Monitor performance analytics with actionable insights
Track issue resolution metrics, monitor team performance, and understand your workflow patterns with Workspace Analytics' three comprehensive analytics dashboards.
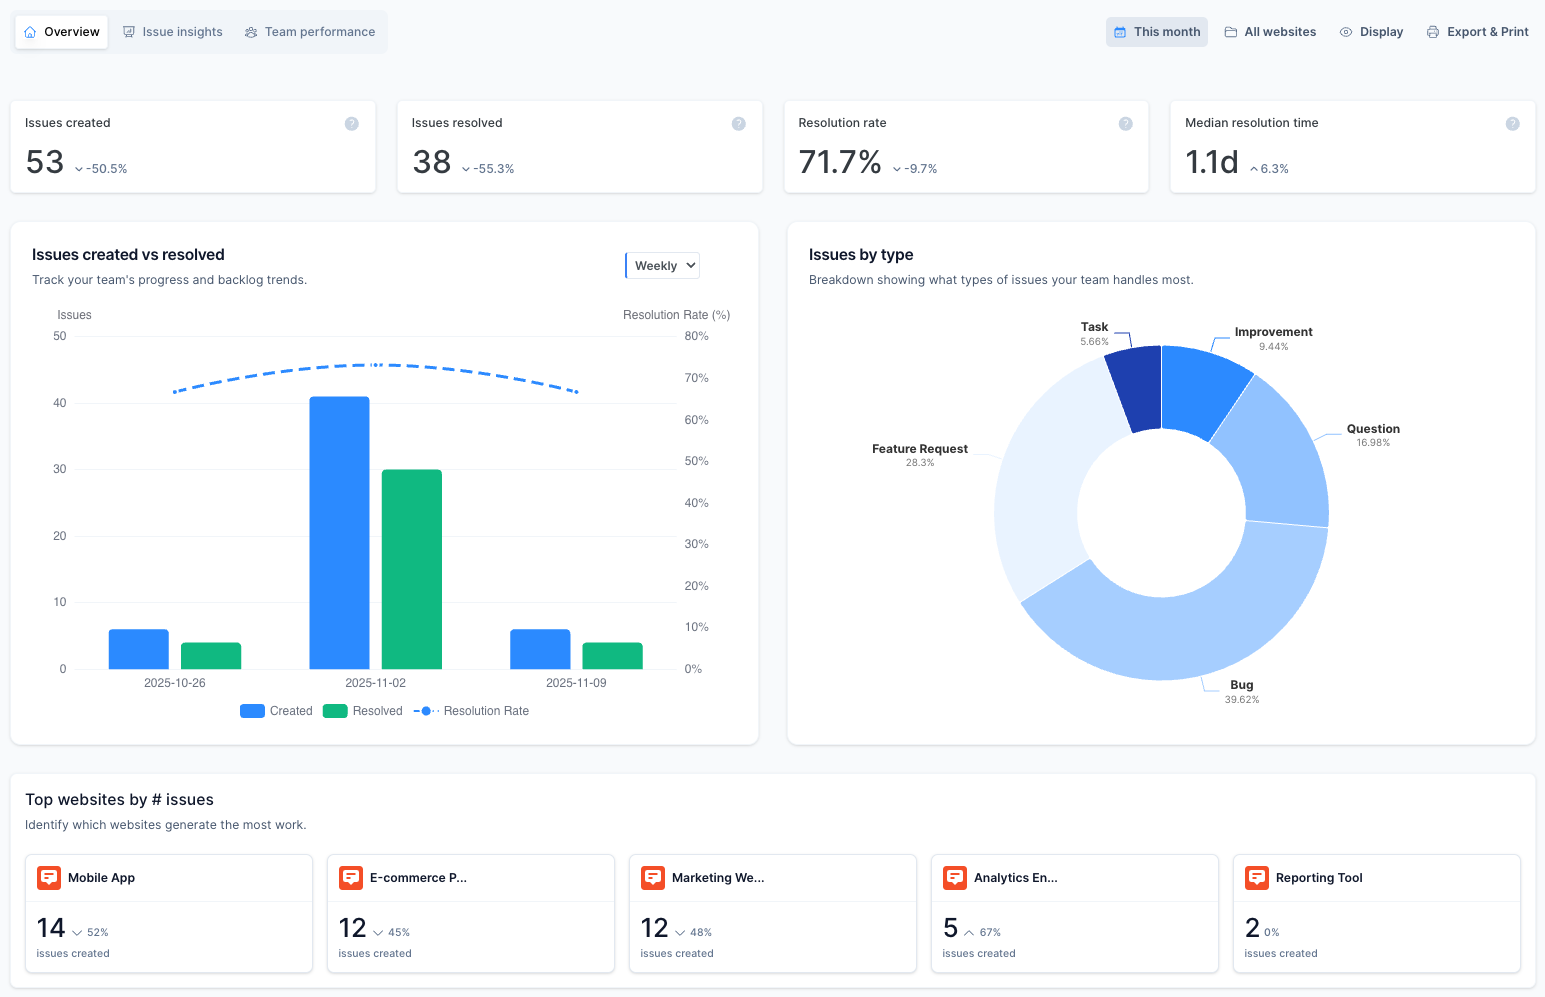
Overview dashboard
Your top-line metrics in one place, so you can spot trends and potential issues quickly.
Key issue insights
Identify patterns in issue types, priorities, and technical characteristics.
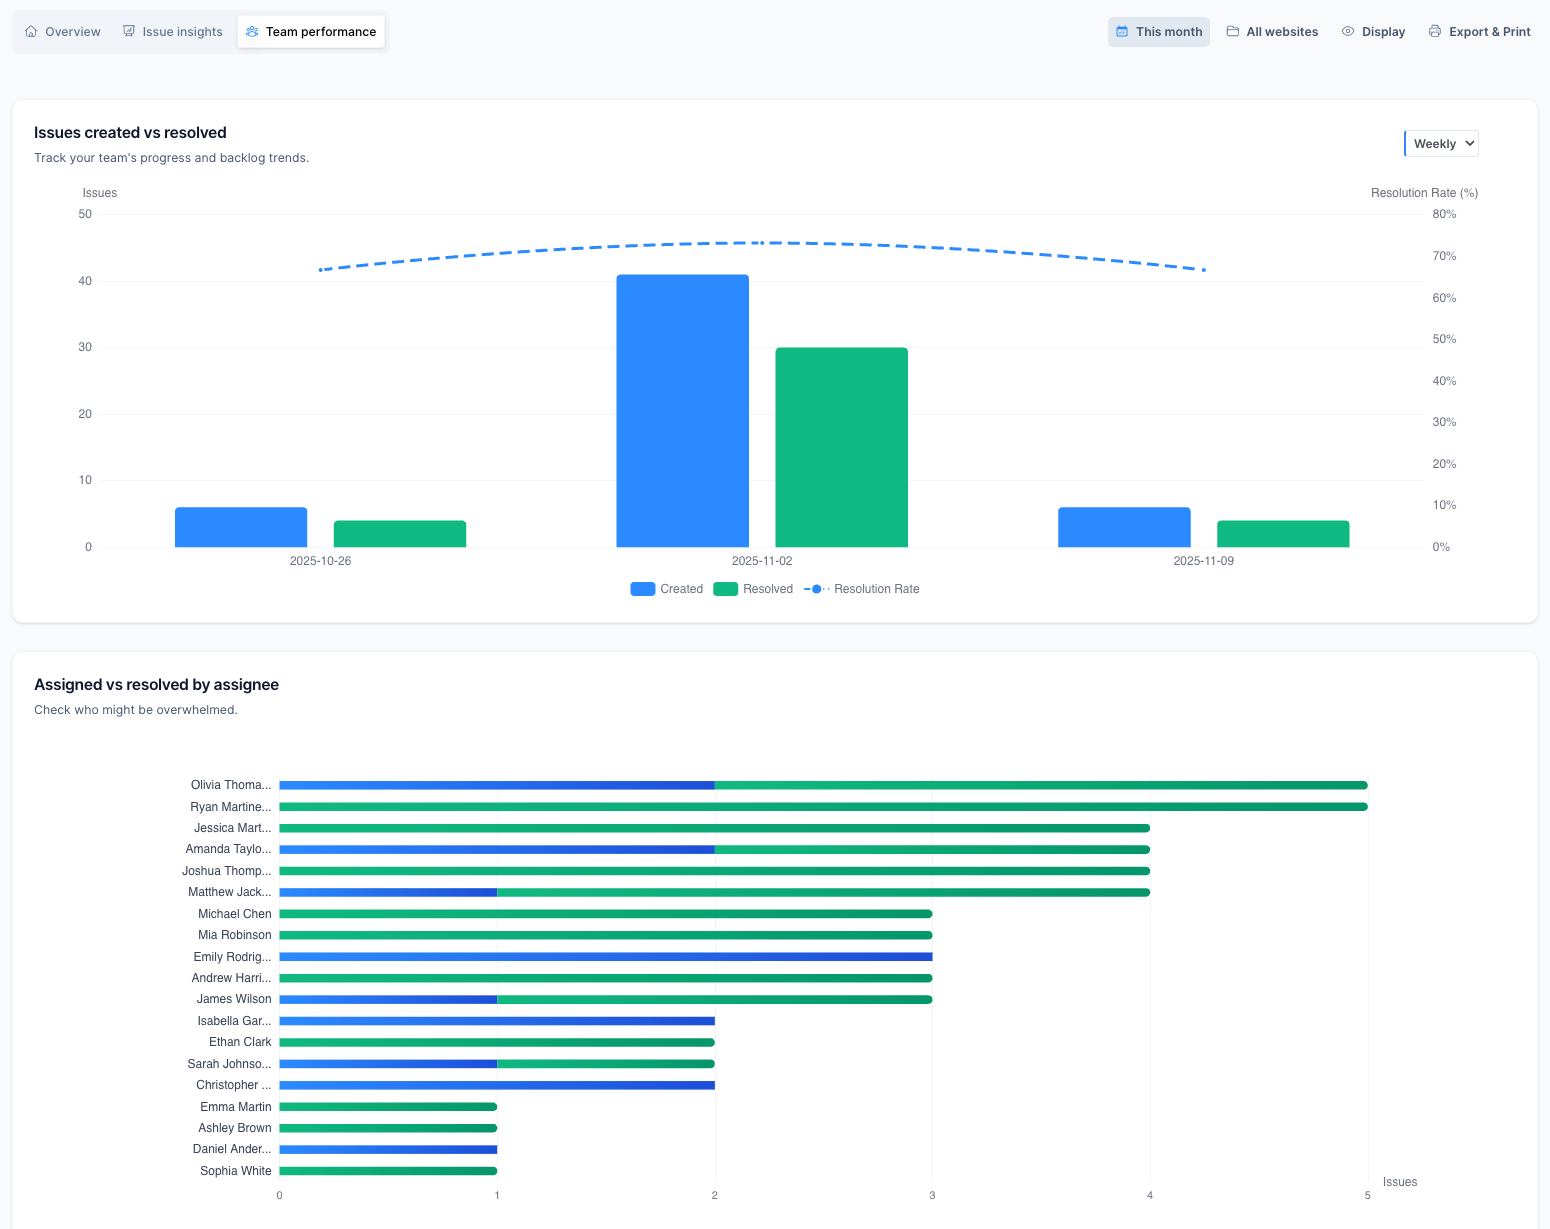
Team performance
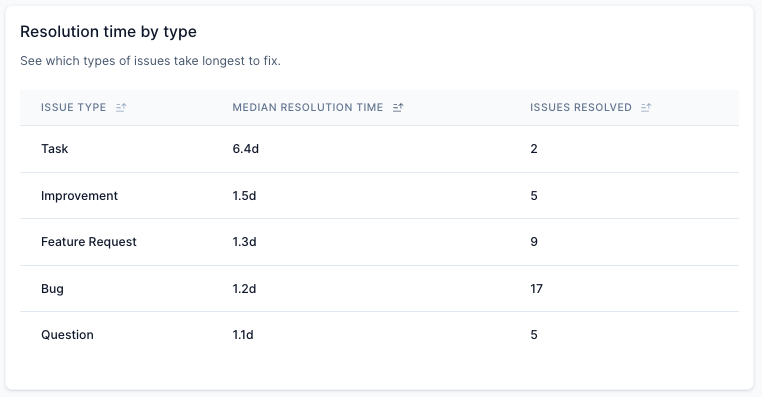
Track resolution speeds, workload distribution, and performance trends.
Identify bottlenecks and fix them quickly
See which projects are eating up too much time, which browsers are causing problems, and who on the team needs support with their tickets.
Get an overview of your workspace
Use the overview dashboard as a snapshot of workspace health where you can monitor incoming work volume, completion rates, and team efficiency.
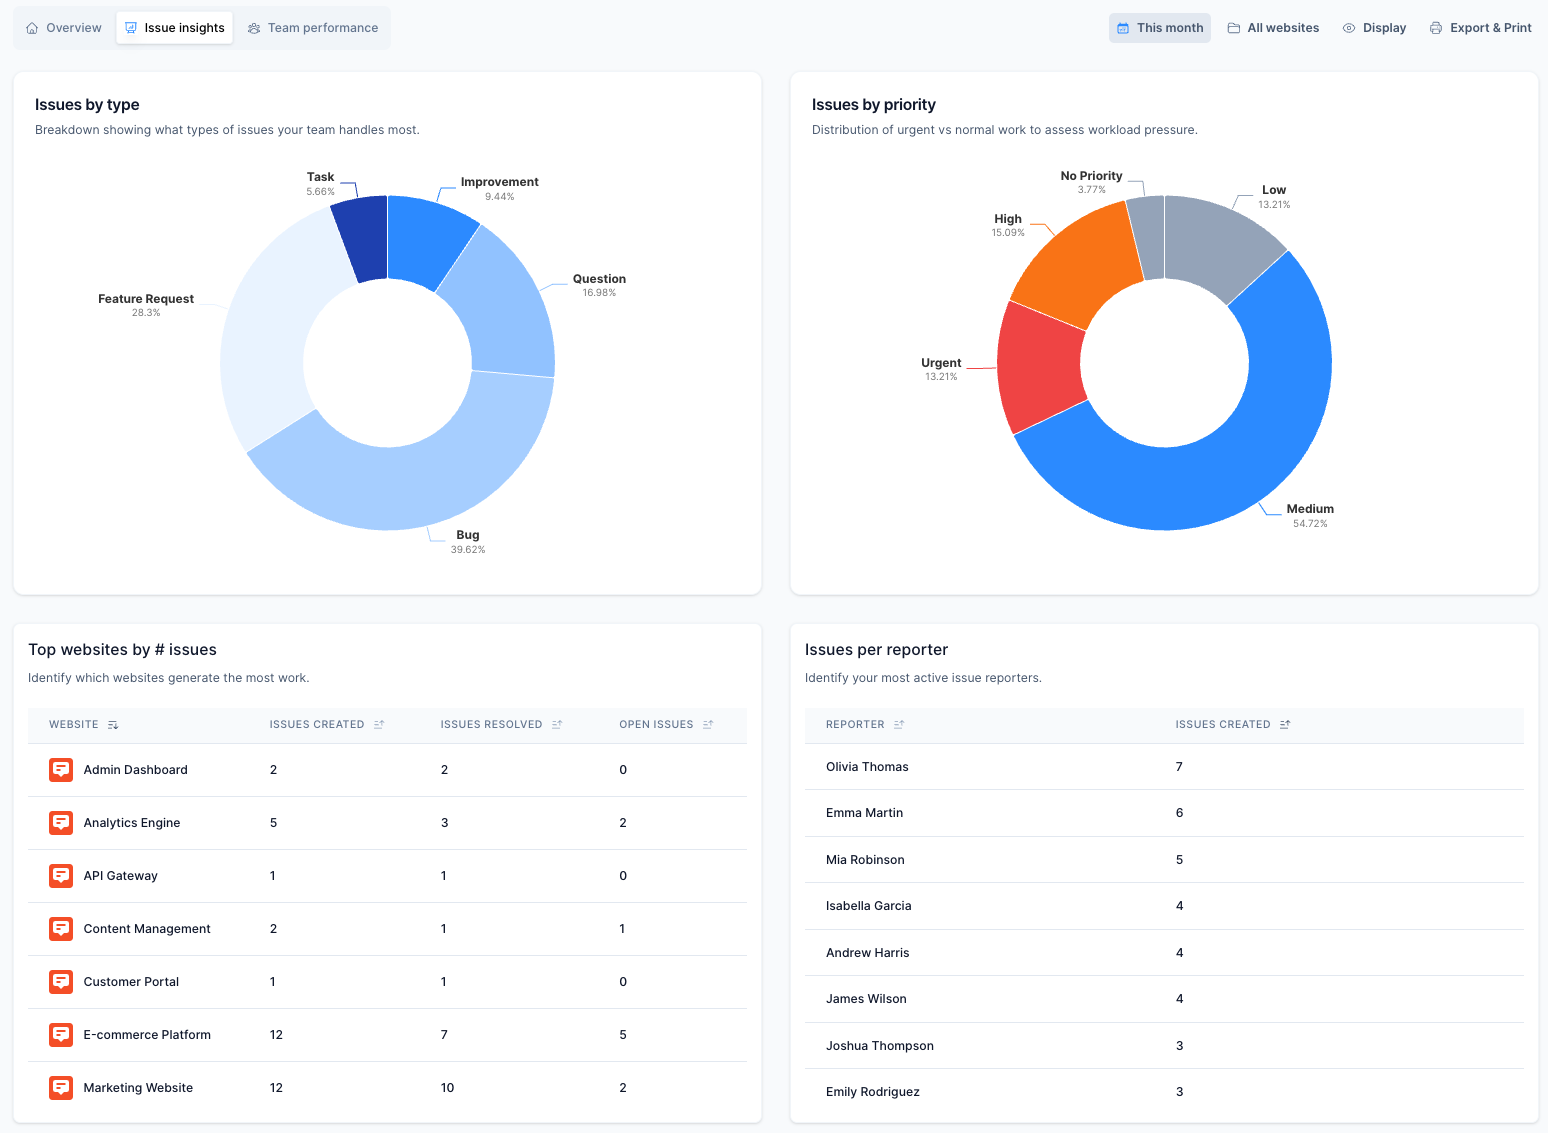
Track your progress
Understand the composition and distribution of your reported issues. Inform testing strategies and resource allocation with issue charts and tables.
Assess your performance
Evaluate individual and team efficiency so you can optimize productivity and identify coaching opportunities. Act quickly to fix problems or leverage opportunities.

“Clients say, “You’re not working fast enough”. We show them: “You logged 1000 tickets this week. We evaluated 600 in a day”. The knowledge of how many tickets came in and were resolved is super valuable.”
Customize your insights dashboard
Create a workspace insights view that's tailored to your needs, with the charts you need to see.
Project filters
Decide whether you want to see all your projects, or just drill down into a specific one.
Custom date ranges
Select specific start and end dates for your data, or choose one of the predefined options.
Hidden charts
Hide charts that aren't relevant to your workflow so they aren't included in digital or printed dashboards.
Access key metrics
Analyze over a dozen data points to fully understand your team’s performance, including:
.svg)
Analyze issues reported from any device
With Marker.io, you can collect feedback on mobile, table or desktop. Use the insights feature to spot trends in which issues are on which devices.
How you can use Workspace Analytics
Web operations
Spot and fix bottlenecks in your release process and shift from being reactive to continuously improving.
Project managers
Identify resource-heavy projects to adjust allocation and prove the team is meeting commitments with efficiency metrics.
QA teams
Focus your testing on browsers with the highest issue rates and track resolution speed changes to address performance shifts.
Team leads
Match resource allocation to what's urgent and identify training needs by comparing performance.
Agency owners
Spot when accounts exceed your SLAs so you can renegotiate and justify billing with work volume metrics.
Keep your data fresh
Your insights data is updated every 15 minutes and then retained for 24 months, so you can act quickly and then monitor performance over time.

“Seeing which resolutions generate the most issues helps us focus our testing where layouts actually break.”
Get started now
Free 15-day trial • No credit card required • Cancel anytime