Webflow Speed Mastery: How to Get 90+ on Pagespeed Insights
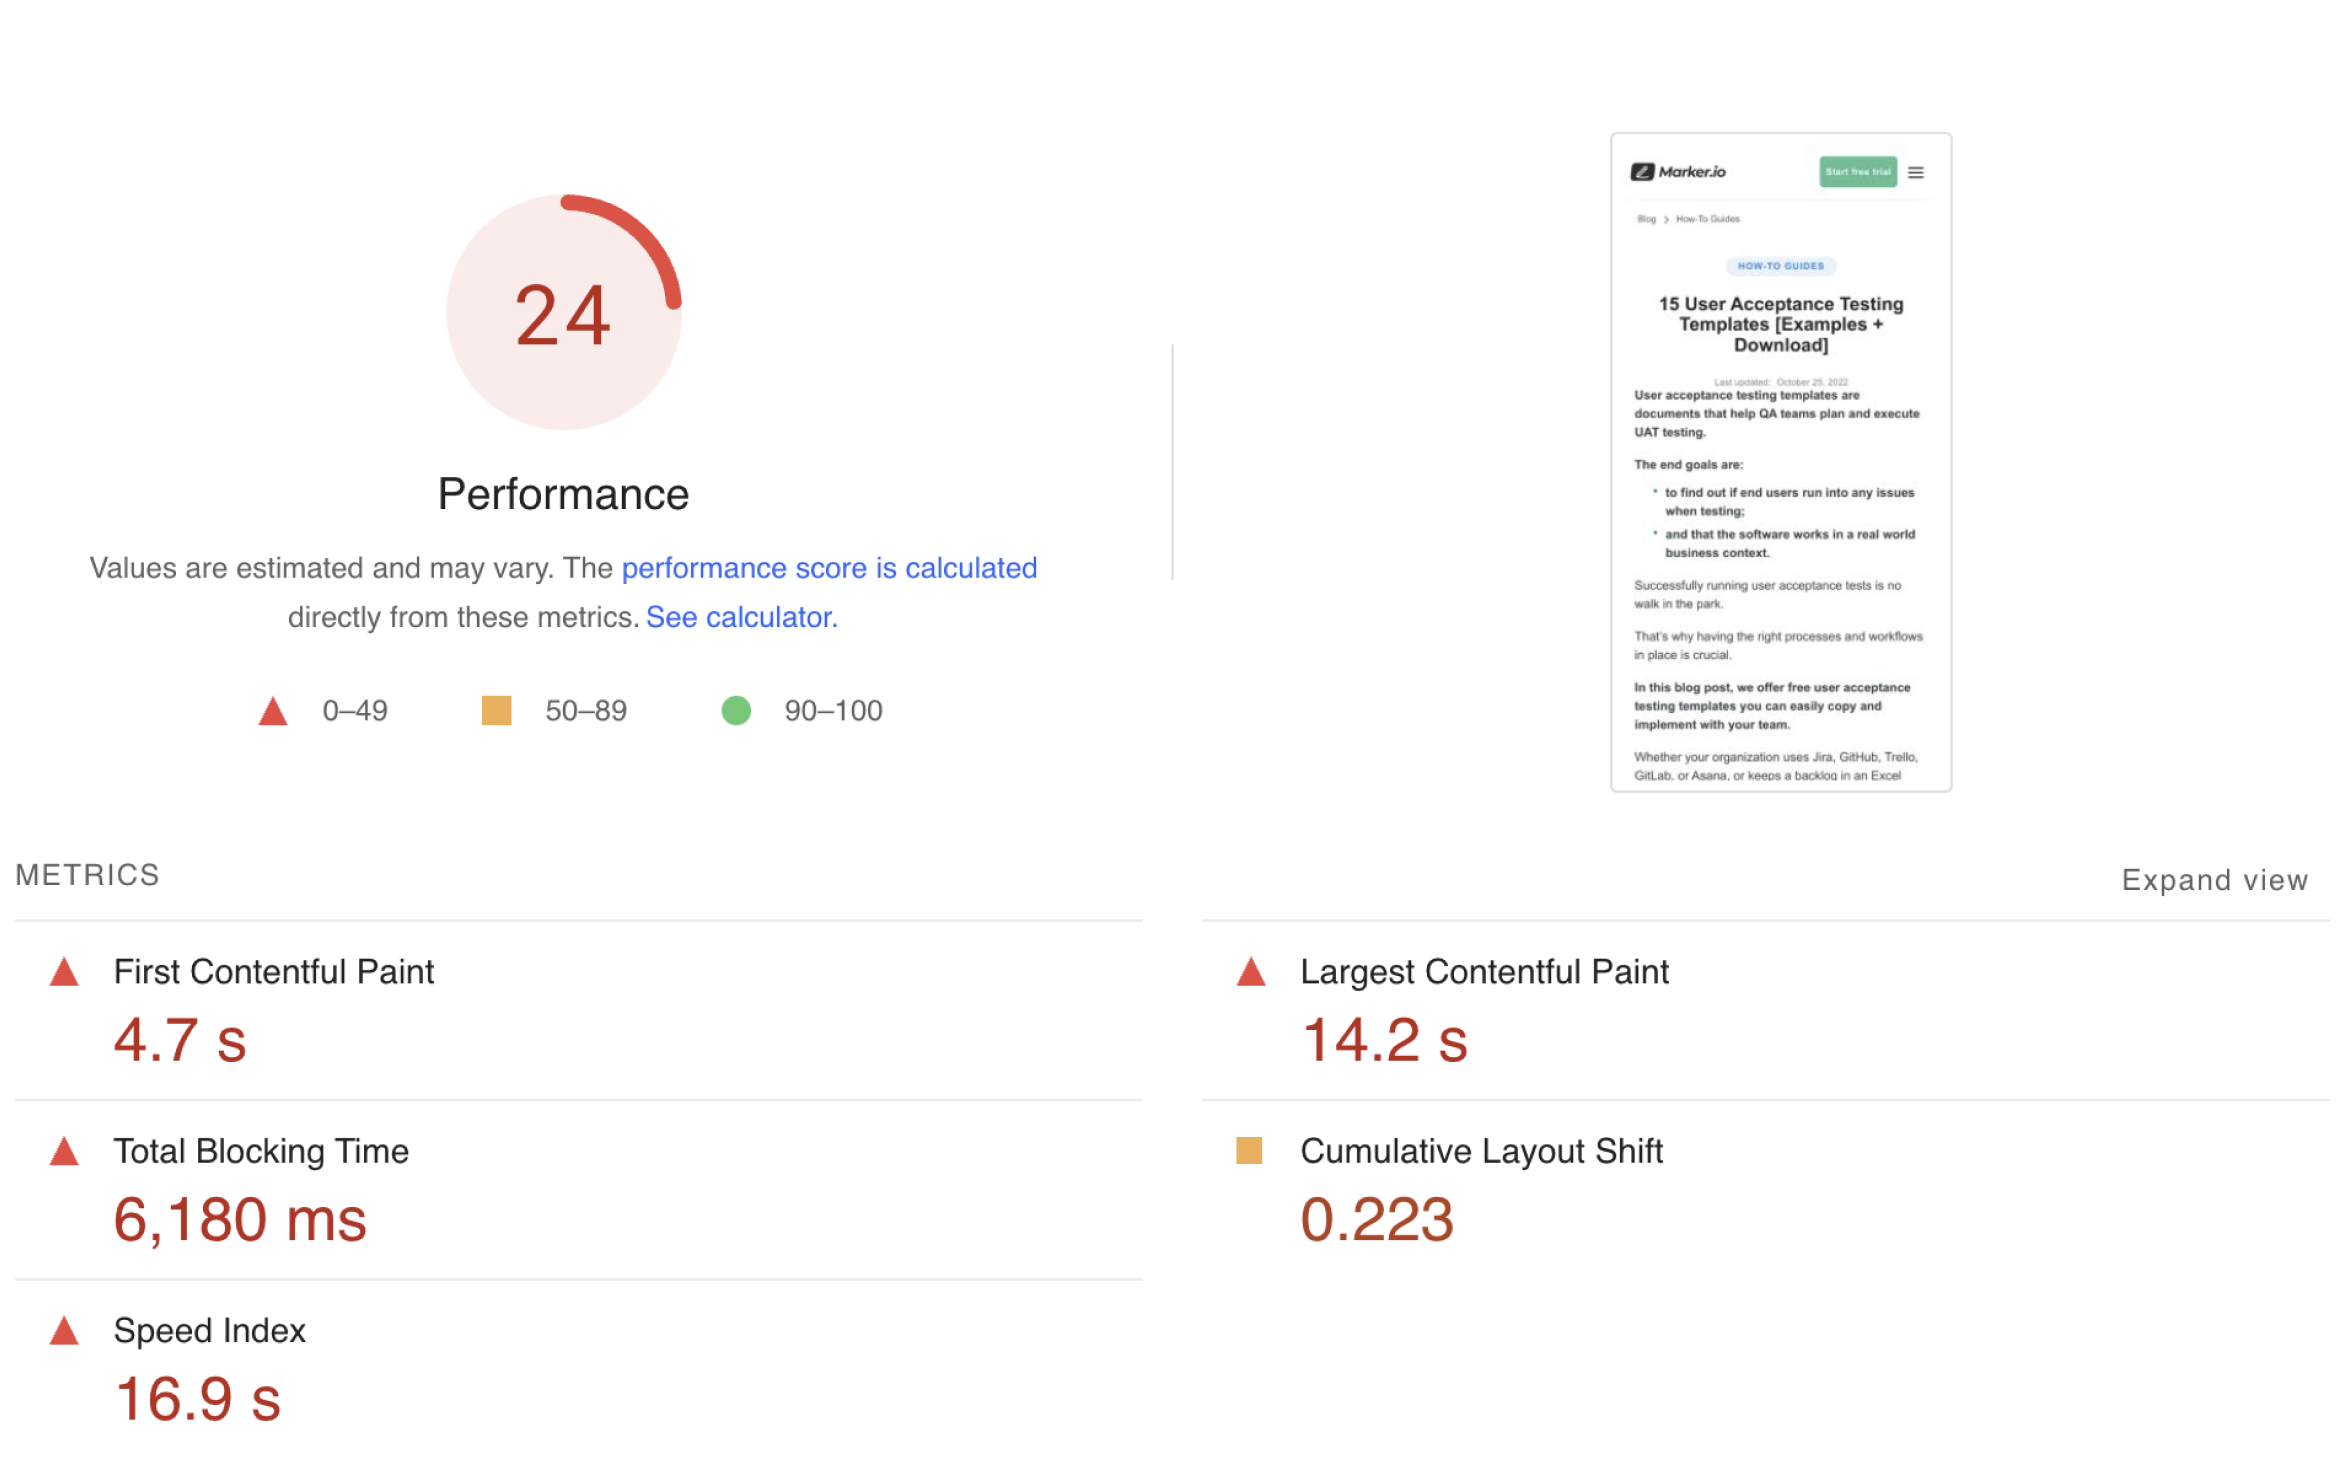
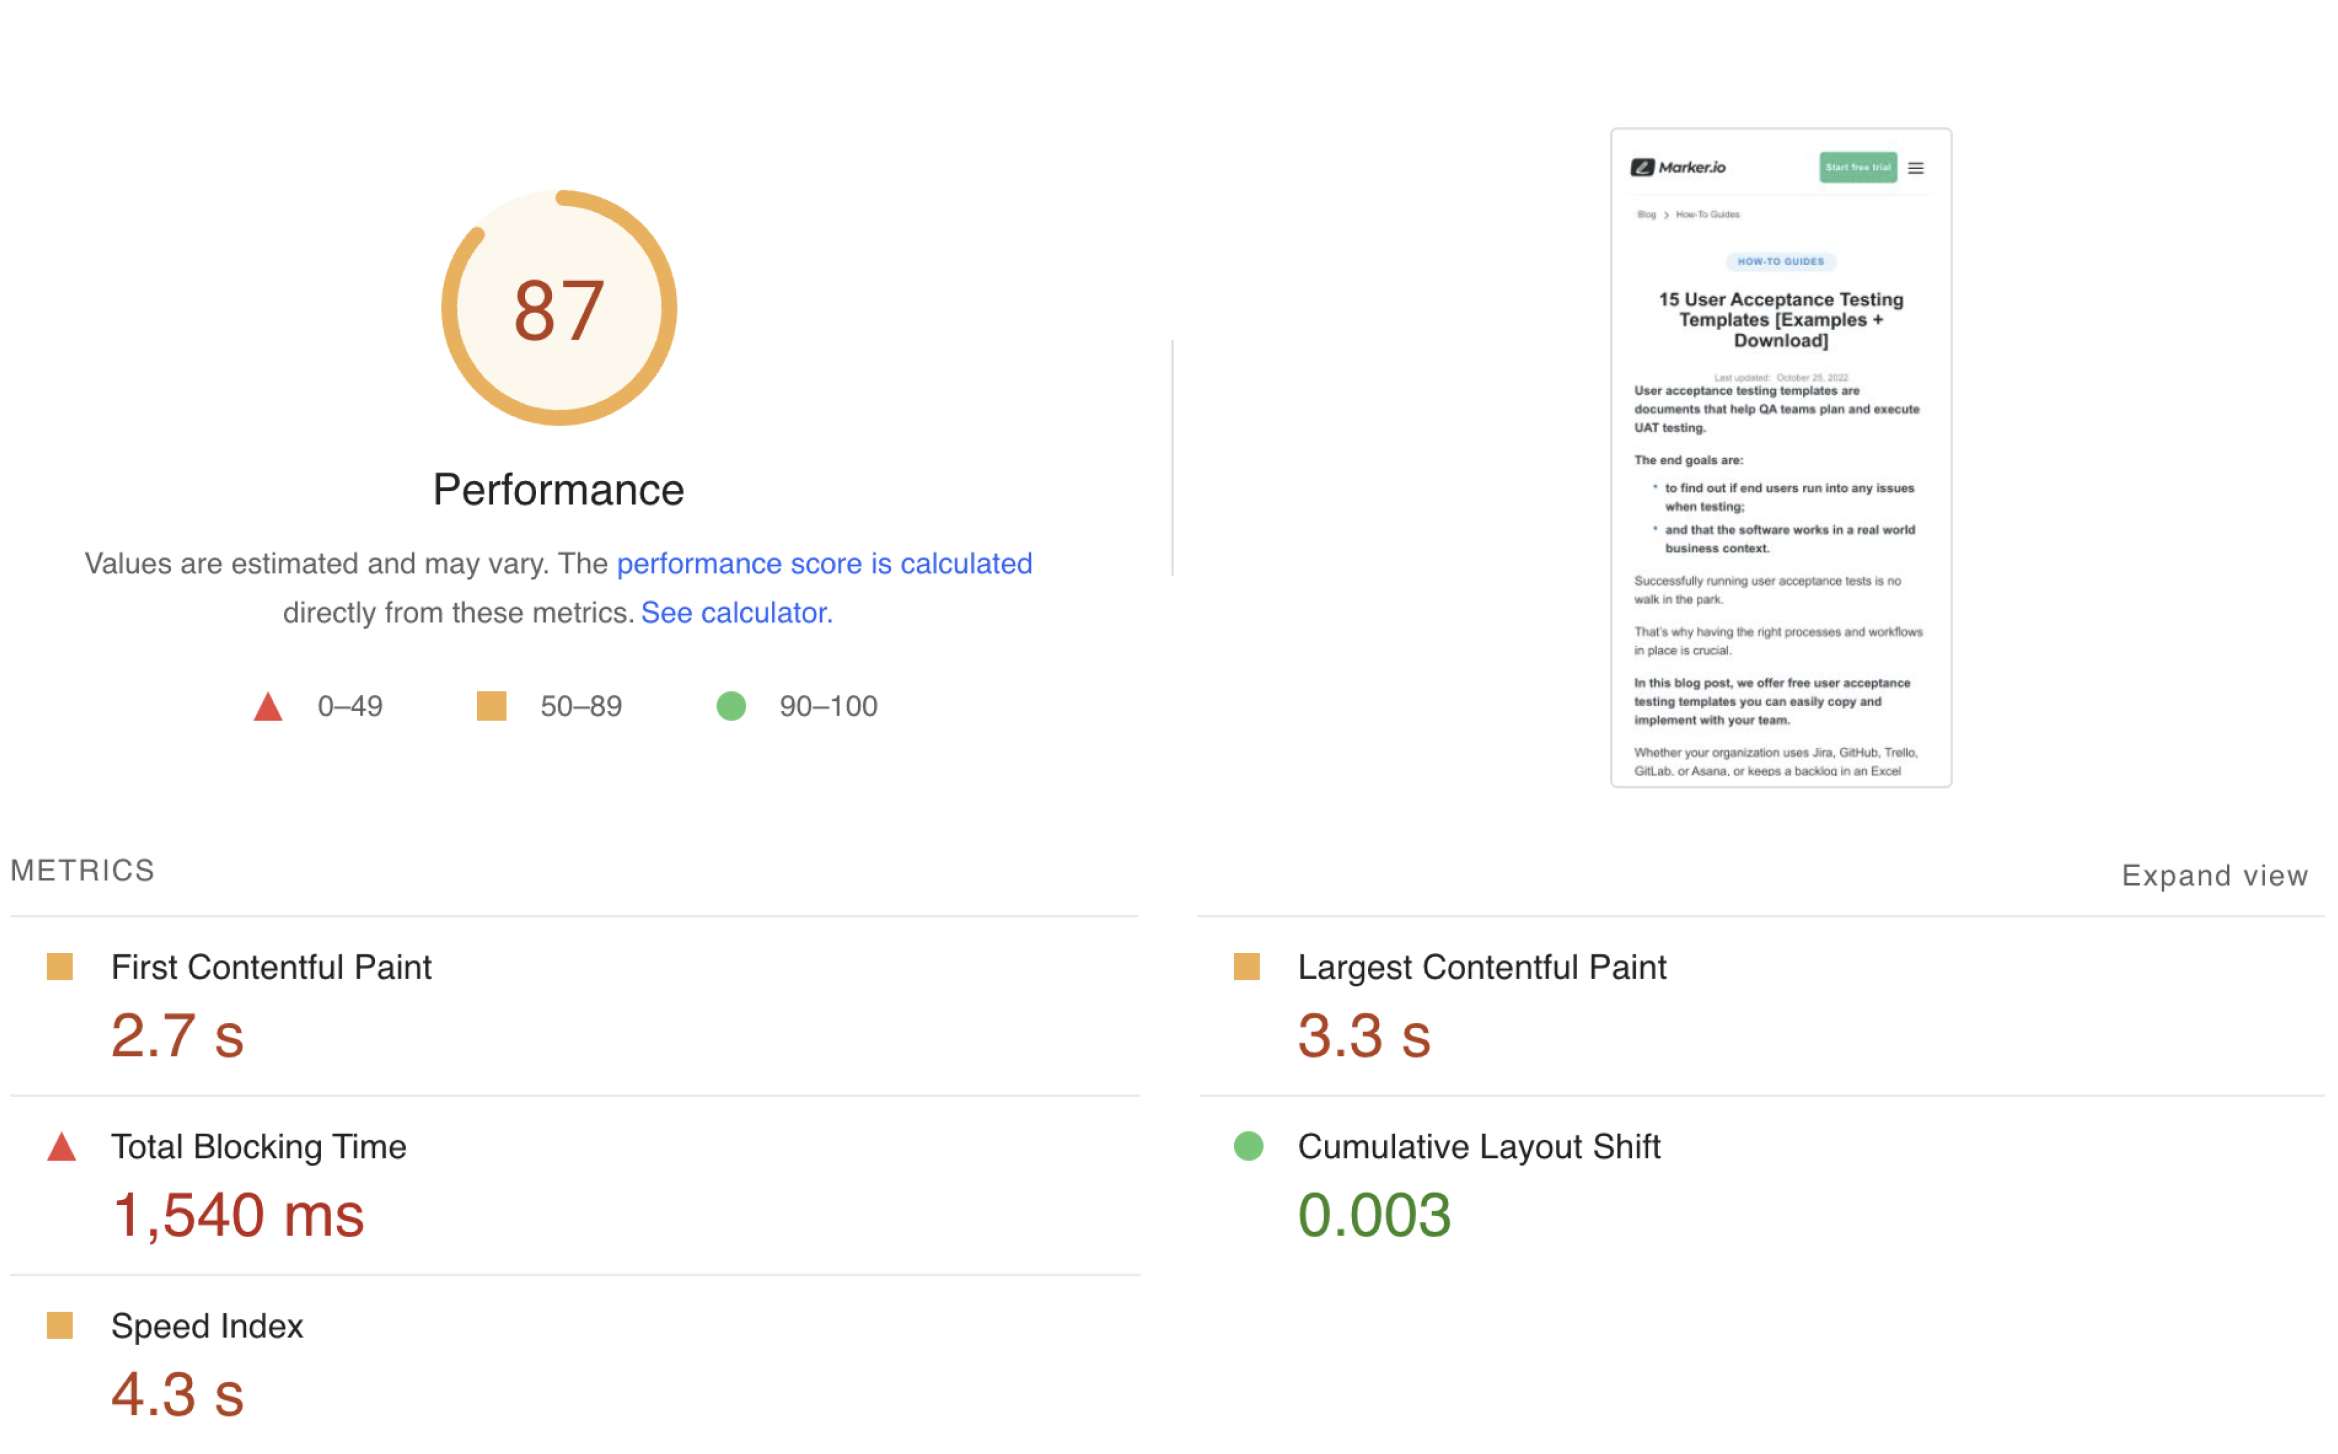
In this blog post, I’ll teach you how we optimized our Webflow site speed—from a low performance score of 27 to a whopping 90 on Google Pagespeed Insights.


In this blog post, I’ll teach you how we optimized our Webflow site speed—from a low performance score of 27 to a whopping 90 on Google Pagespeed Insights.
As Head of SEO, my job is to maximize traffics and leads to our website. This includes:
- Researching keywords on topics that interest our audience
- Writing in-depth content
- Building backlinks
- etc.
But another critical aspect of robust SEO is on-page optimization.
Naturally, I tested our site speed with Google Pagespeed Insights. But I was shocked to find out how poor our score was:
We love working with Webflow, but their CMS has limitations. It's frustrating. It seemed there wasn't much I could do.
So, I teamed up with Emile (one of our co-founders) and we decided to find out how to maximize our score.
At a minimum, we needed to pass our Core Web Vitals Assessment. That's the benchmark Google uses to determine whether our pages offer a good experience.
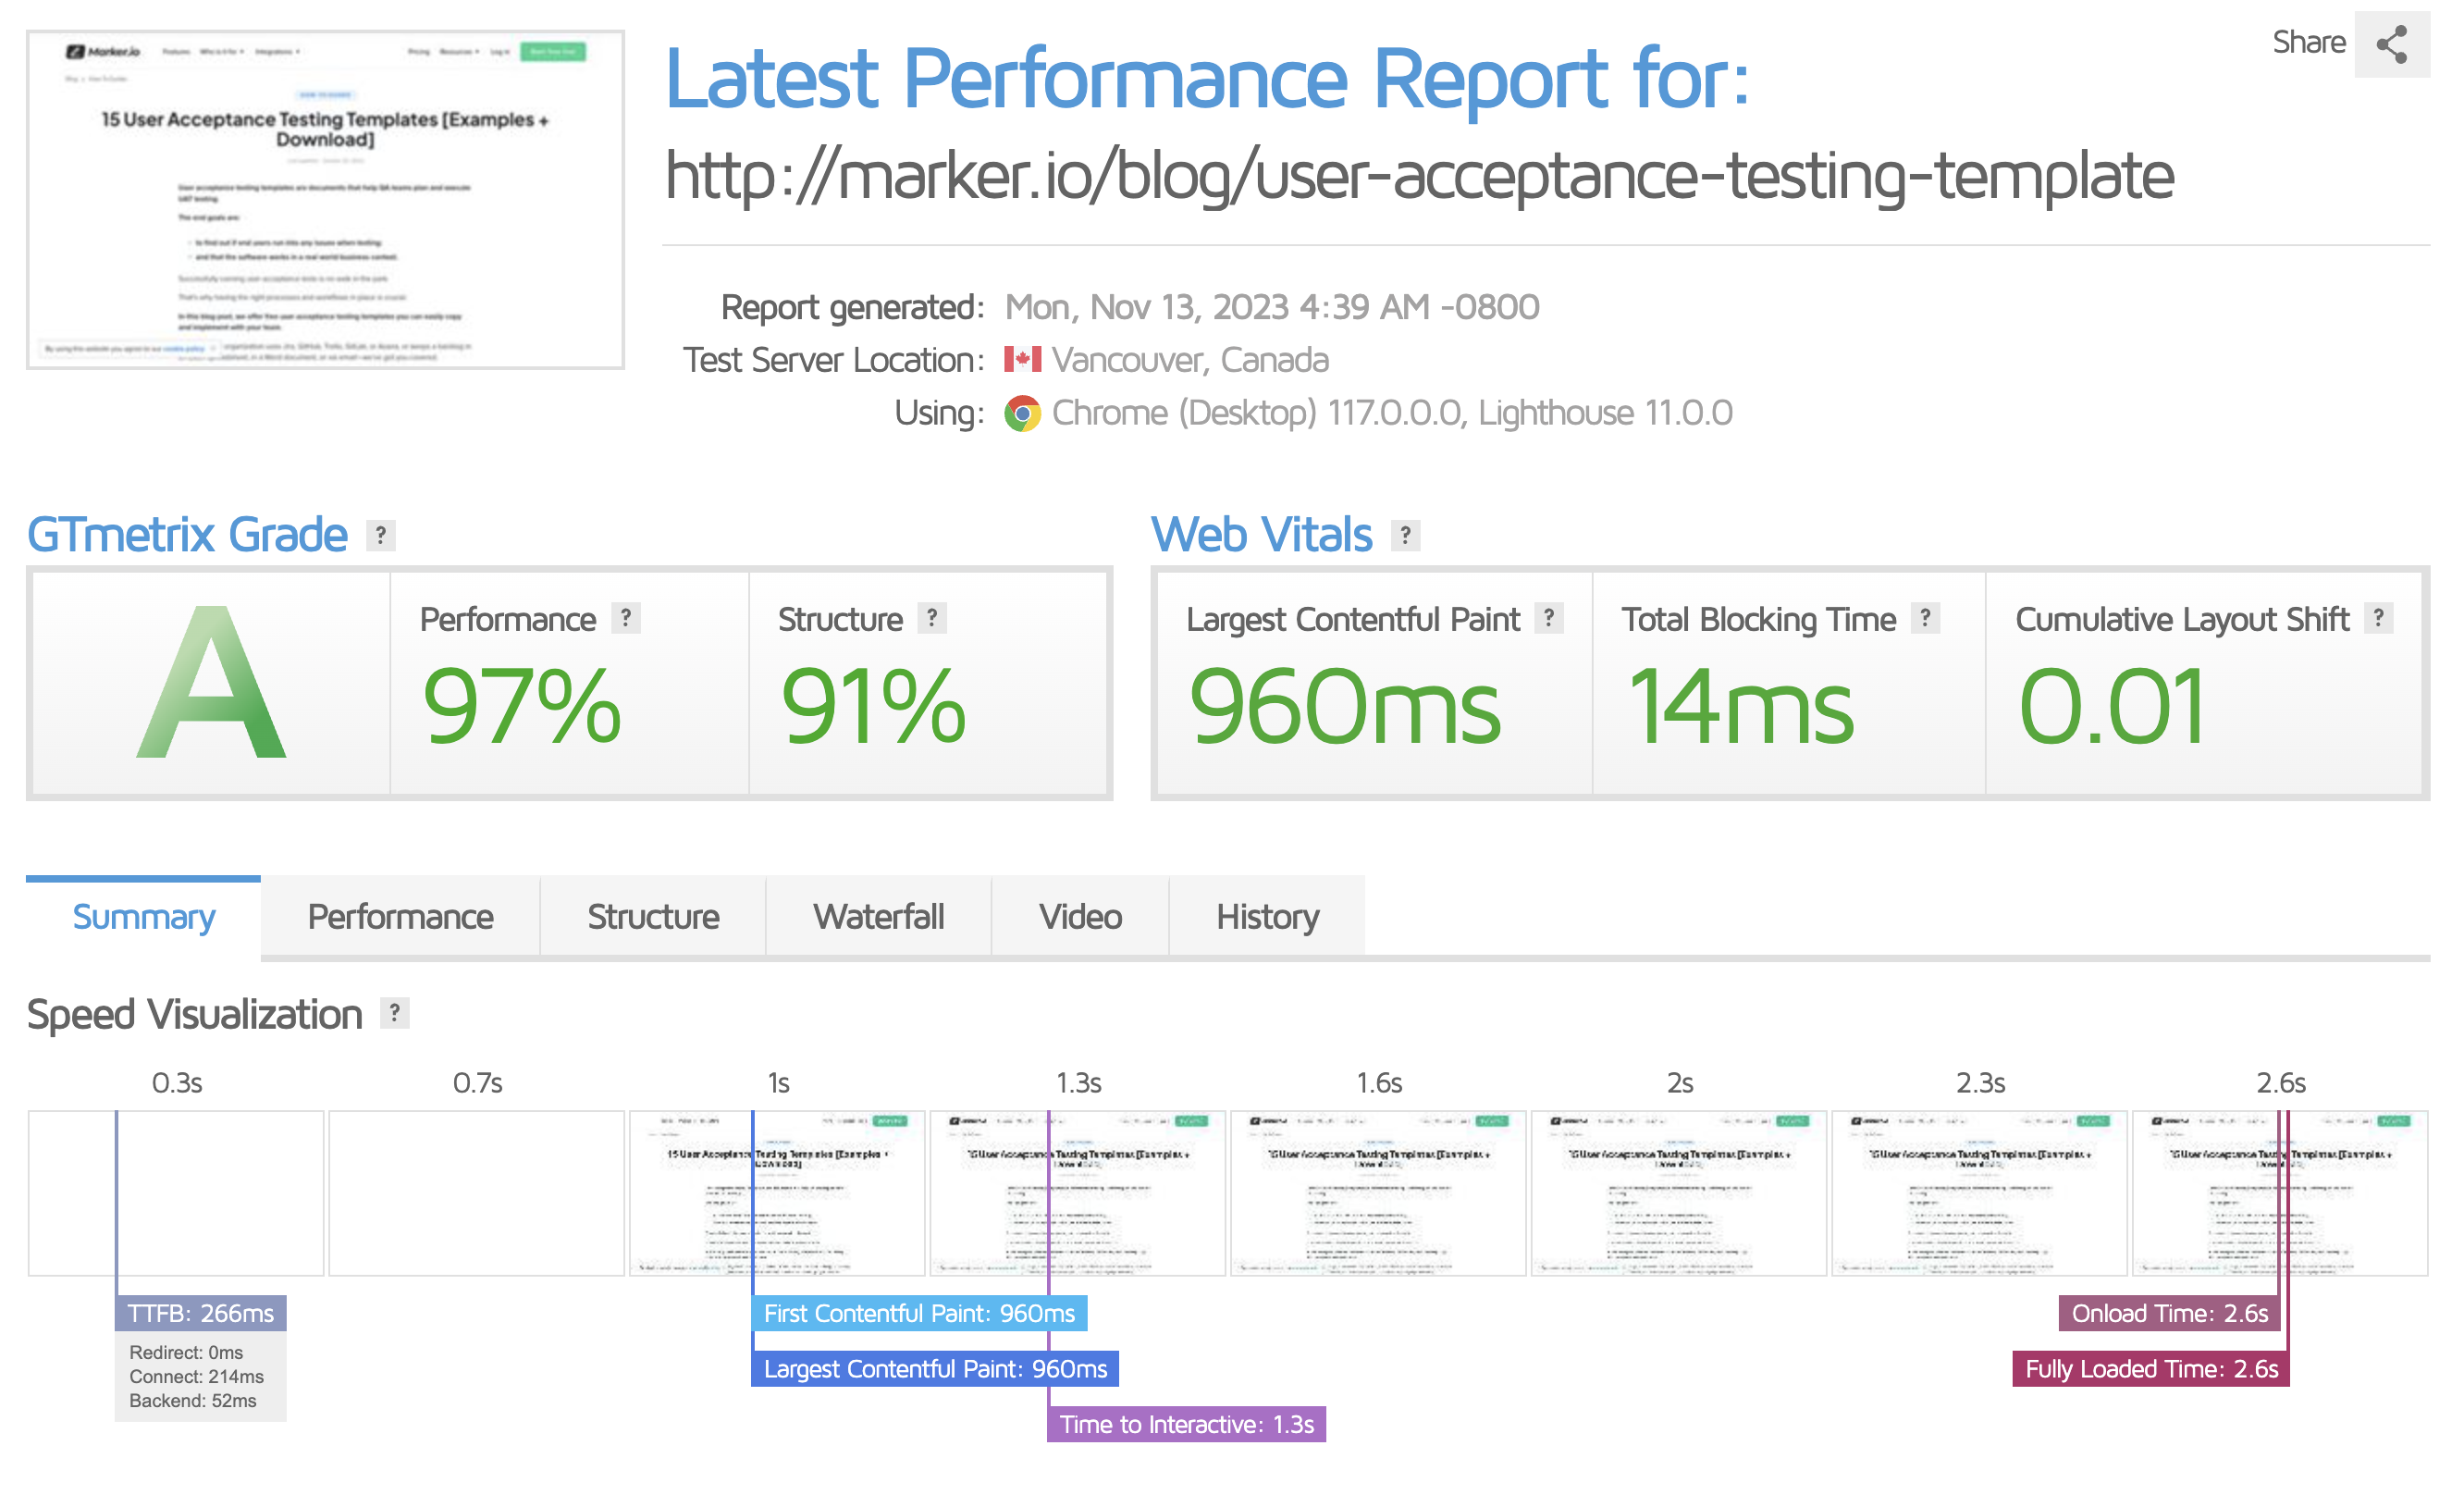
And that, we did:
A word of caution: you might have seen other websites or people boasting fast load speeds and a score of 99 to 100 on Pagespeed Insights.
In most cases, this is unachievable.
You need some basics for a functional and attractive website, and they will slow your site down. Google Tag Manager, specific fonts, other third-party JavaScript, you name it.
But you can get pretty close. Today, I’ll show you how!
Let’s get into it.
Why optimize your Webflow page speed?
There are many benefits to optimizing your page speed:
- Better user experience
- Enhanced SEO rankings
- Improved conversion rates
- ...and more
For us, it was a mix of SEO and user experience:
- It didn’t feel great to open the website on a slower connection
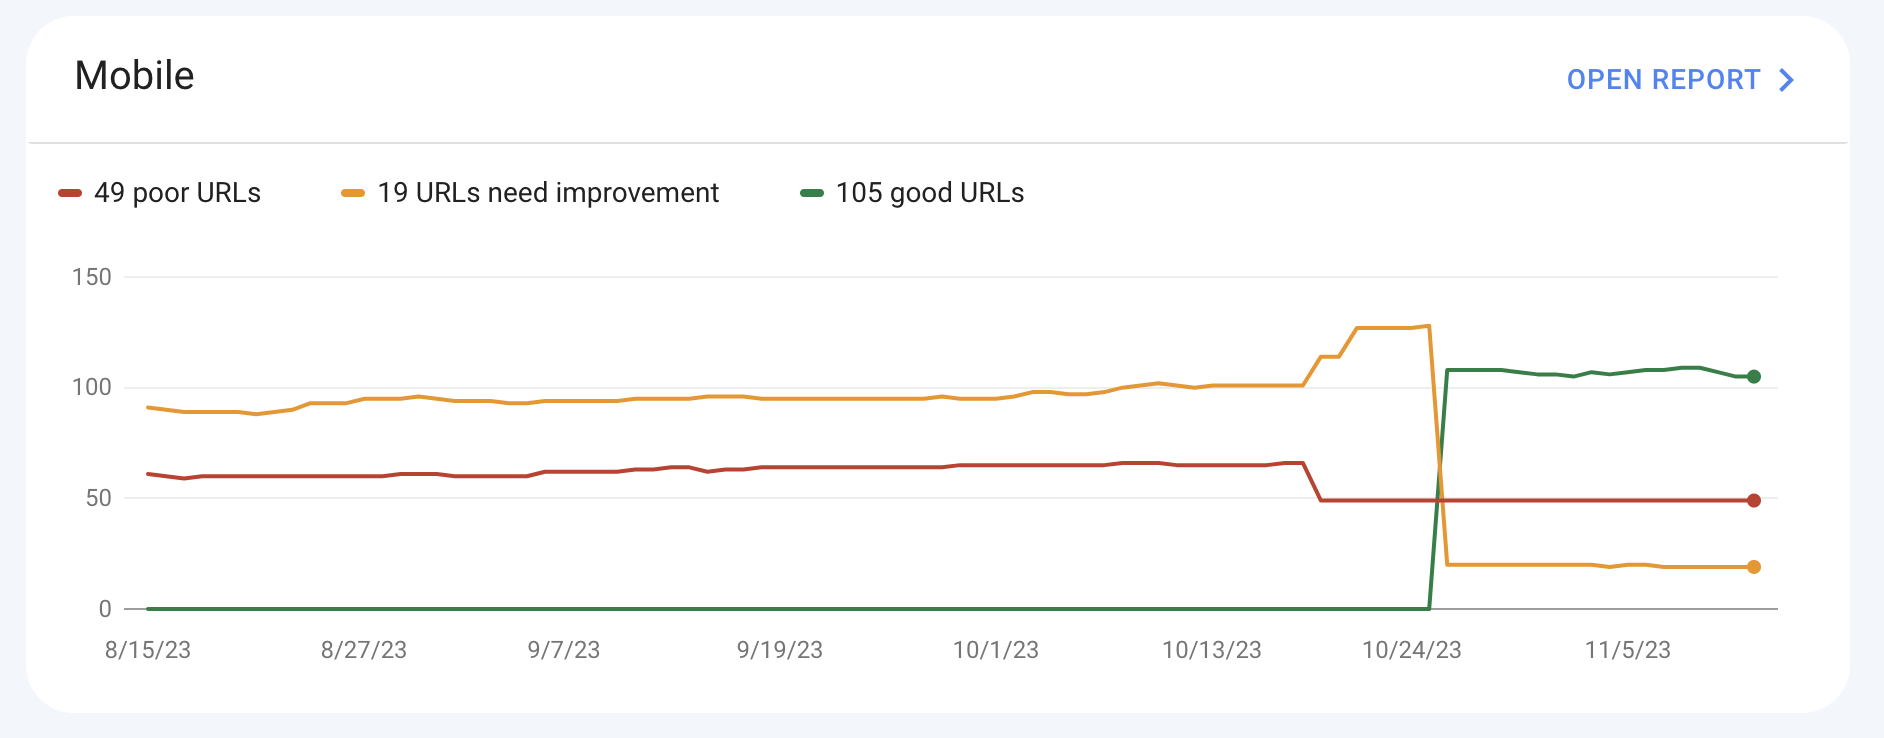
- We had zero URLs Google considered "Good" on Mobile
After our changes, 100% of our blog pages are considered Good pages:
Why not optimize the rest of the site?
Here’s our reasoning, and it goes back to the “basic functionalities” I was referring to earlier:
In some cases, design and functionality simply trump speed.
For example, our homepage is still relatively slow, but:
- We know the high-quality video above the fold helps with conversions, and we’re not ready to remove it
- We need third-party scripts (like Intercom) that are not required on the blog
- We use multiple fonts and animations that make our page look better
We’re still testing, so this might change in the future, but it makes sense for now.
Webflow page speed optimization checklist
Here are the steps we took to fix our Webflow page load issues. I’ll go over how we identified the problems, and provide solutions for the ones we decided to act on.
If you run into other issues, let us know—as we want this page to be the go-to speed resource for all Webflow developers.
1. Assessing the issues
The first step is to identify what slows your site down and decide what’s worth investigating.
There are two tools that help with this:
- Google Pagespeed Insights. This tool focuses on metrics tied to Google’s understanding of user experience and SEO, such as Largest Contentful Paint (LCP) or Cumulative Layout Shift (CLS).
- GTmetrix provides a broader technical performance evaluation. You’ll get insights on page size, number of requests, and more
In the reports, you’ll see all items and their impact on your website performance from highest to lowest—a great starting point.
The rest of this post will focus on Pagespeed Insights recommendations, but I like to use both tools for a complete overview.
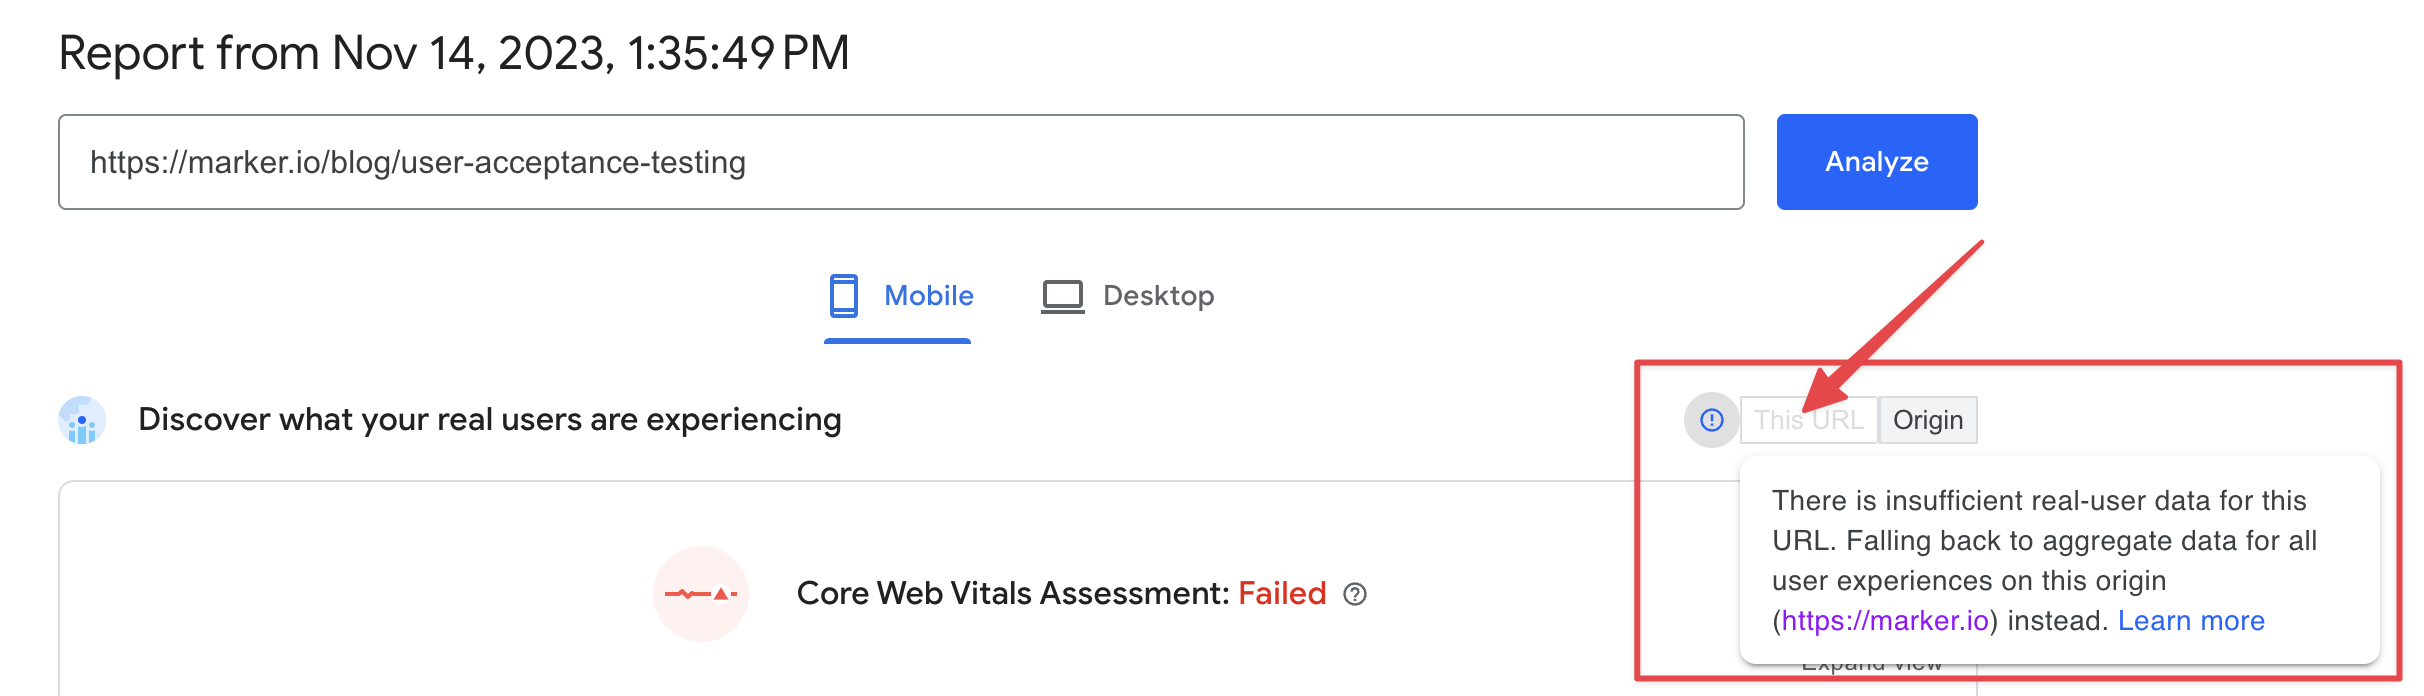
Quick note on Pagespeed Insights: when reviewing the Core Web Vitals Assessment, select “This URL” if available. Otherwise, the tool will fall back to your homepage.
2. Common problem #1: Properly size images
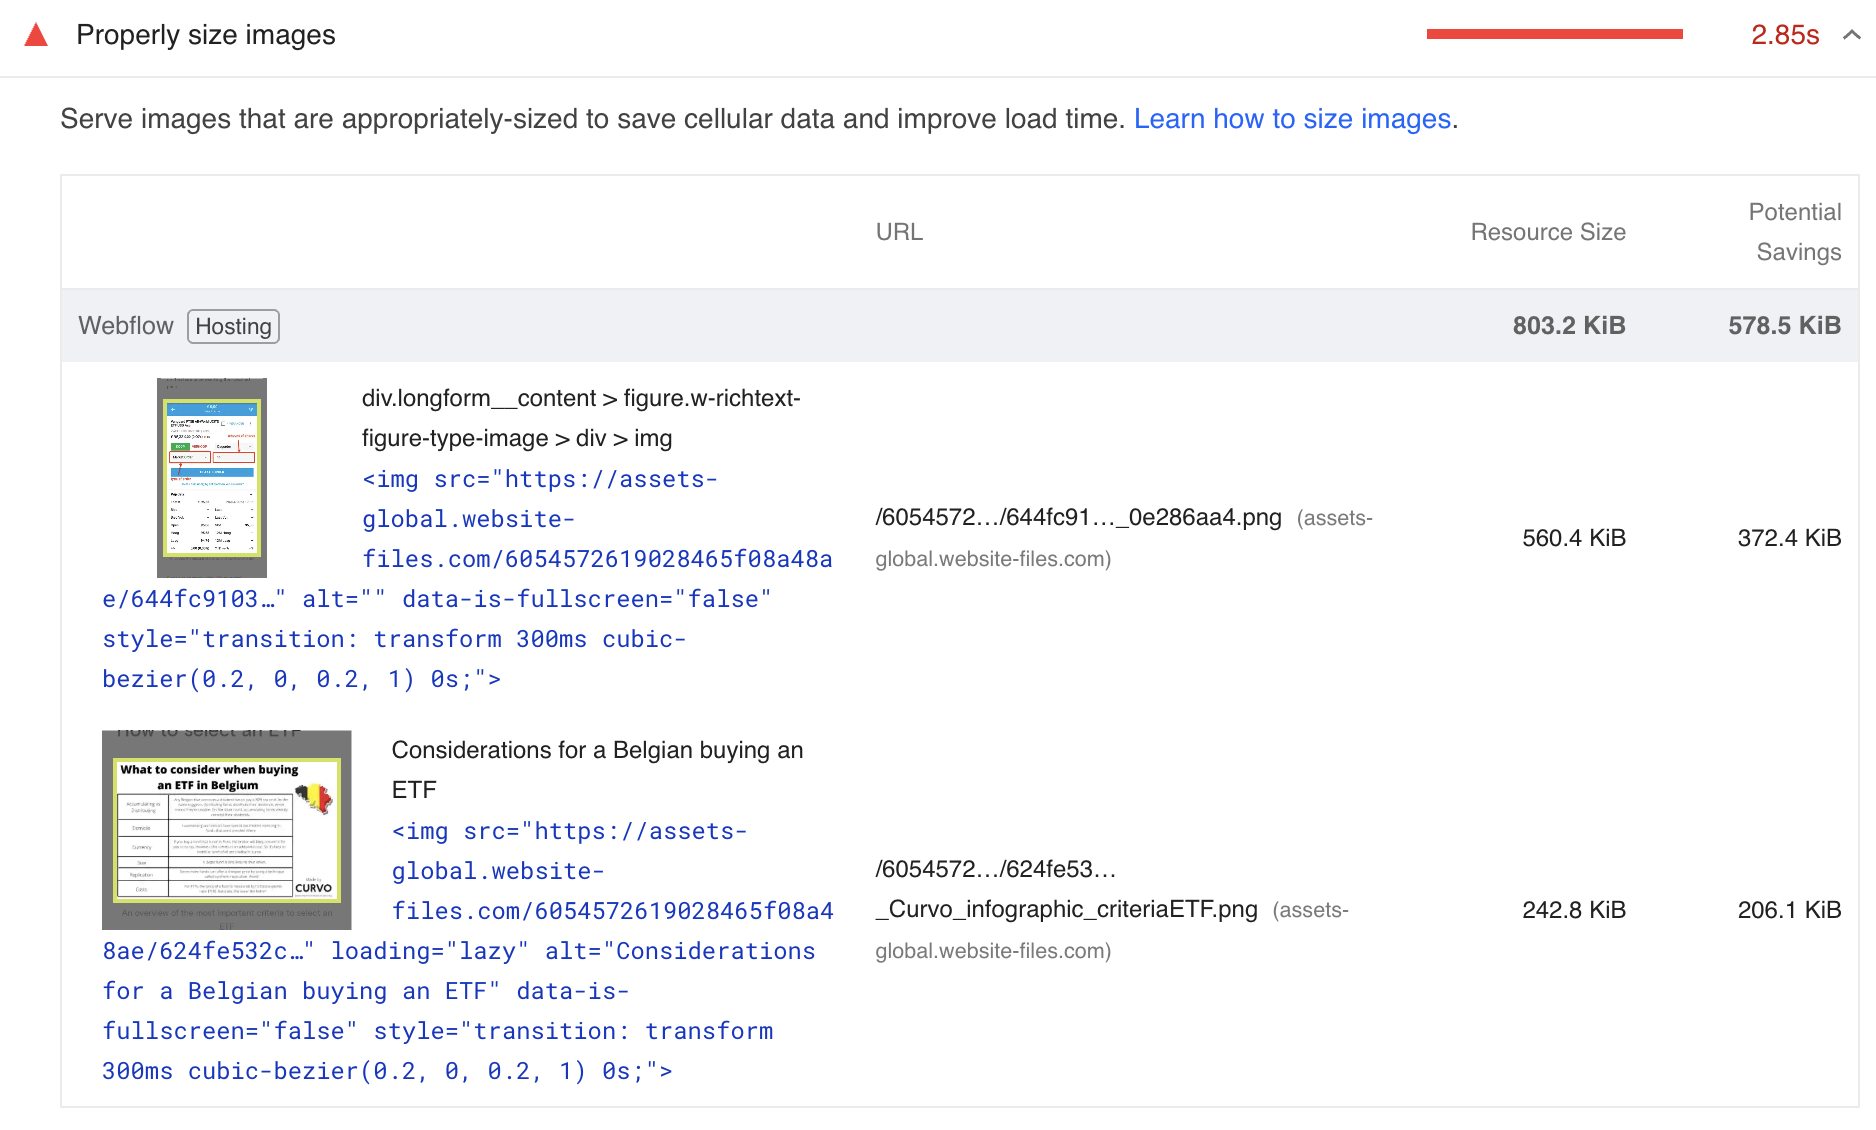
Webflow automatically creates variants of uploaded images to make sure they load fast on any device. Yet, this does not work with the CMS.
This was the biggest issue for us.
Our posts typically include 15+ visuals, and we were serving the images in a much larger version than what’s rendered on the user’s screen, resulting in wasted bytes (up to 30 seconds in potential savings!).
To fix this, we turned to Cloudinary to host our images and GIFs.
The tool creates responsive variants on-the-fly, automatically compresses files, and uses a CDN to serve images.
This is how you can implement Cloudinary for your Webflow CMS:
- Find your blog post template
- Click on the “Gear” icon
- Add your custom code for Cloudinary

For your convenience, we have shared the code we use in this Codepen.
When that’s implemented, all you need to do is add one line of code for your images…
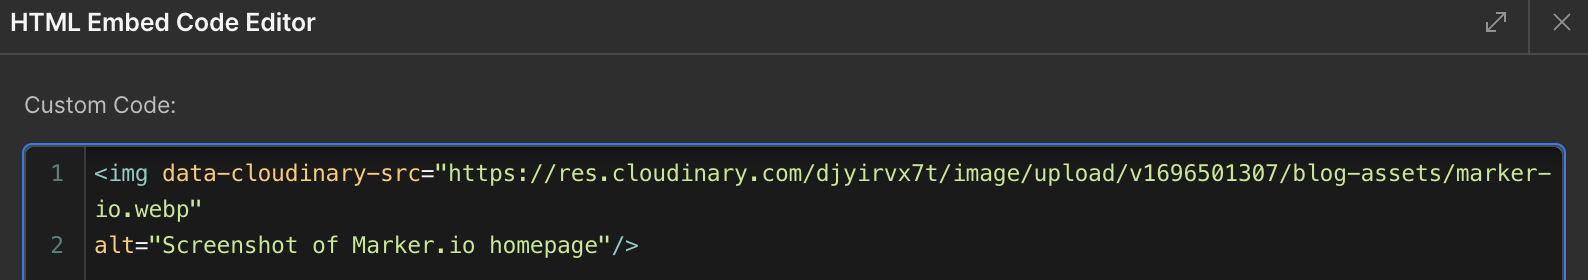
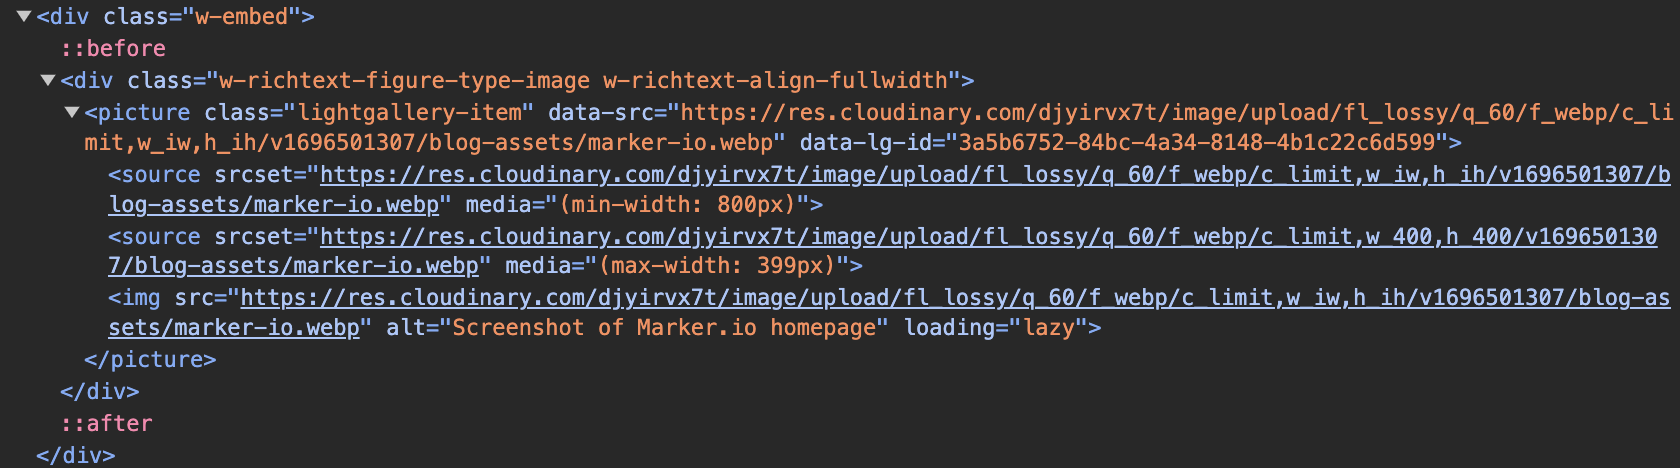
…and Cloudinary takes care of the rest, generating the images for different devices:
3. Common problem #2: Serve images in next-gen formats
Nearly 97% of browsers today support WebP.
When we realized that 99.9% of our website visitors used browsers that support WebP, it was a no-brainer for us to make the switch:
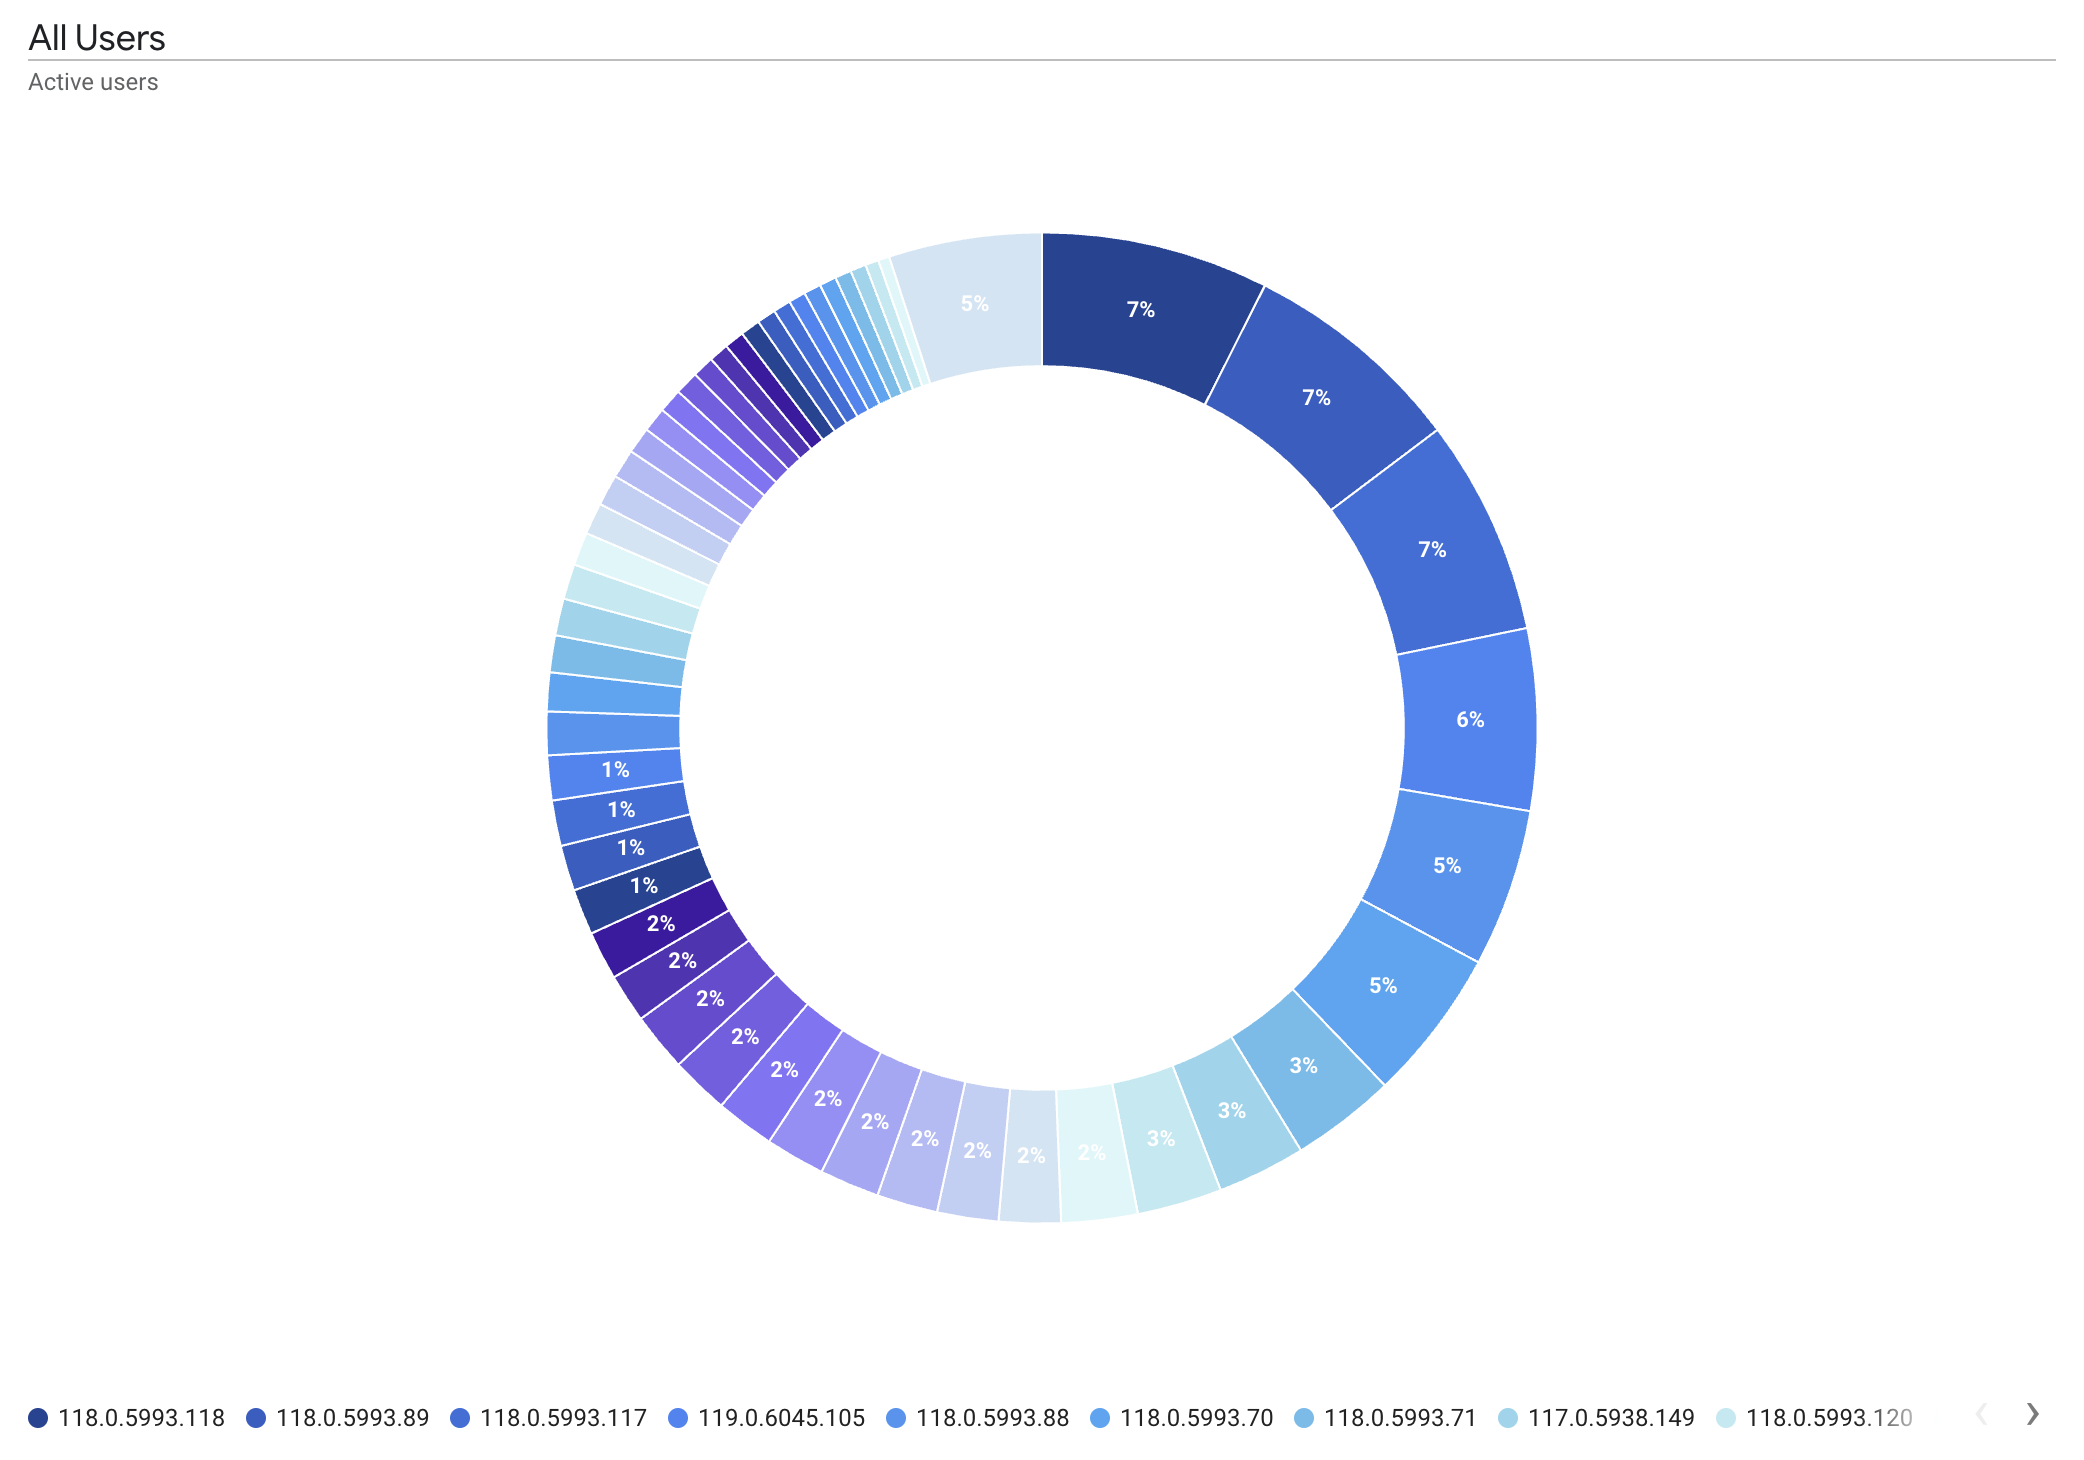
We can’t find a good supporting argument for using old formats like JPEG or PNG anymore.
But if you’d like to check for yourself, you can access the above view in Google Analytics 4 by going to Explore > Create a Free Form report > Add “Browser Version” as a dimension > Donut Chart visualization.
You can use a tool like Optimage to convert your images to WebP. This is a quick win!
Note: if you use Cloudinary, they’ll automatically convert images to the right format, too.
4. Common problem #3: Slow Largest Contentful Paint (LCP) time
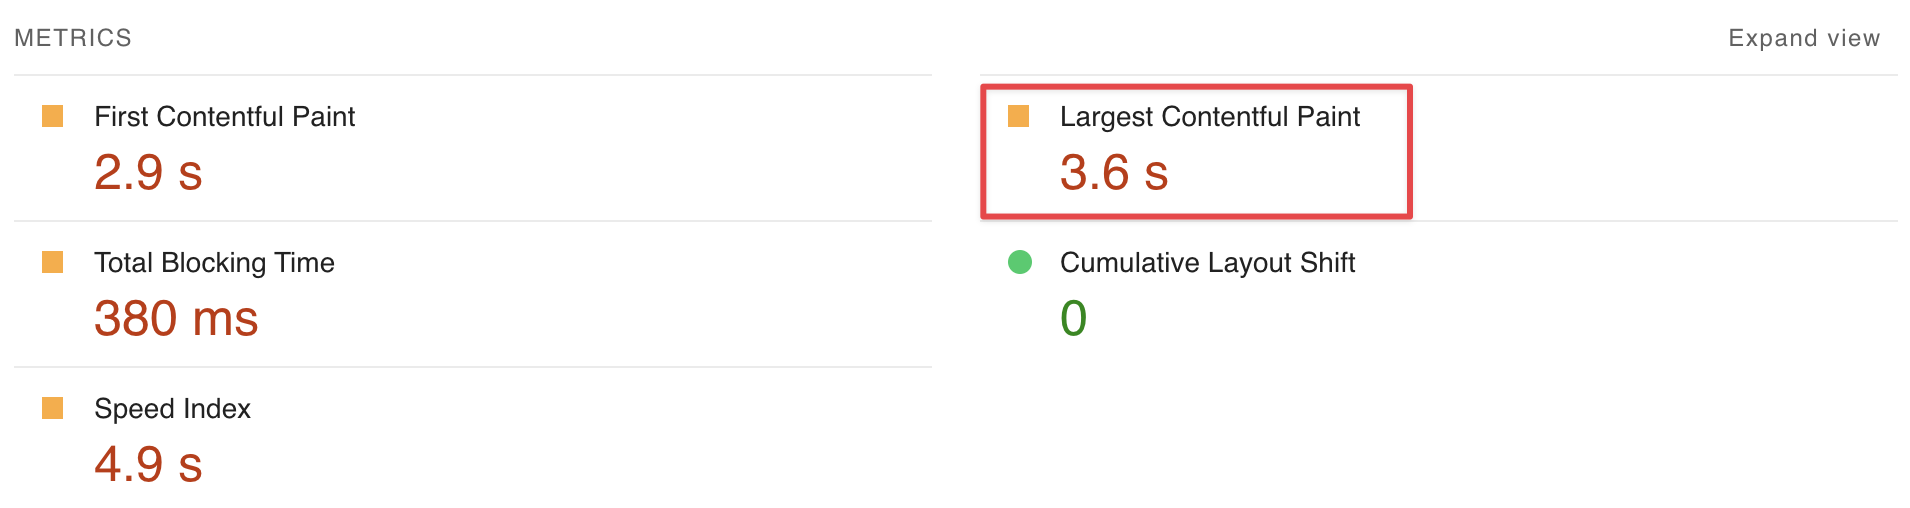
LCP time refers to the moment the largest content element in the viewport is rendered to the screen, AKA when users can see it.
Typically, your largest element will be an image. In some cases, it can be text.
If your LCP is longer than or close to 5 seconds, it’s likely you can optimize it further.
Web.dev offers a detailed explanation on how to optimize your LCP, but to keep it simple and Webflow-specific, here are the four things you can work on:
1. TTFB (Time To First Byte)
How long it takes for the initial HTML to be delivered. You don’t have a lot of control over this, but try to minimize redirects and ensure your images are hosted on a CDN.
2. Load Delay
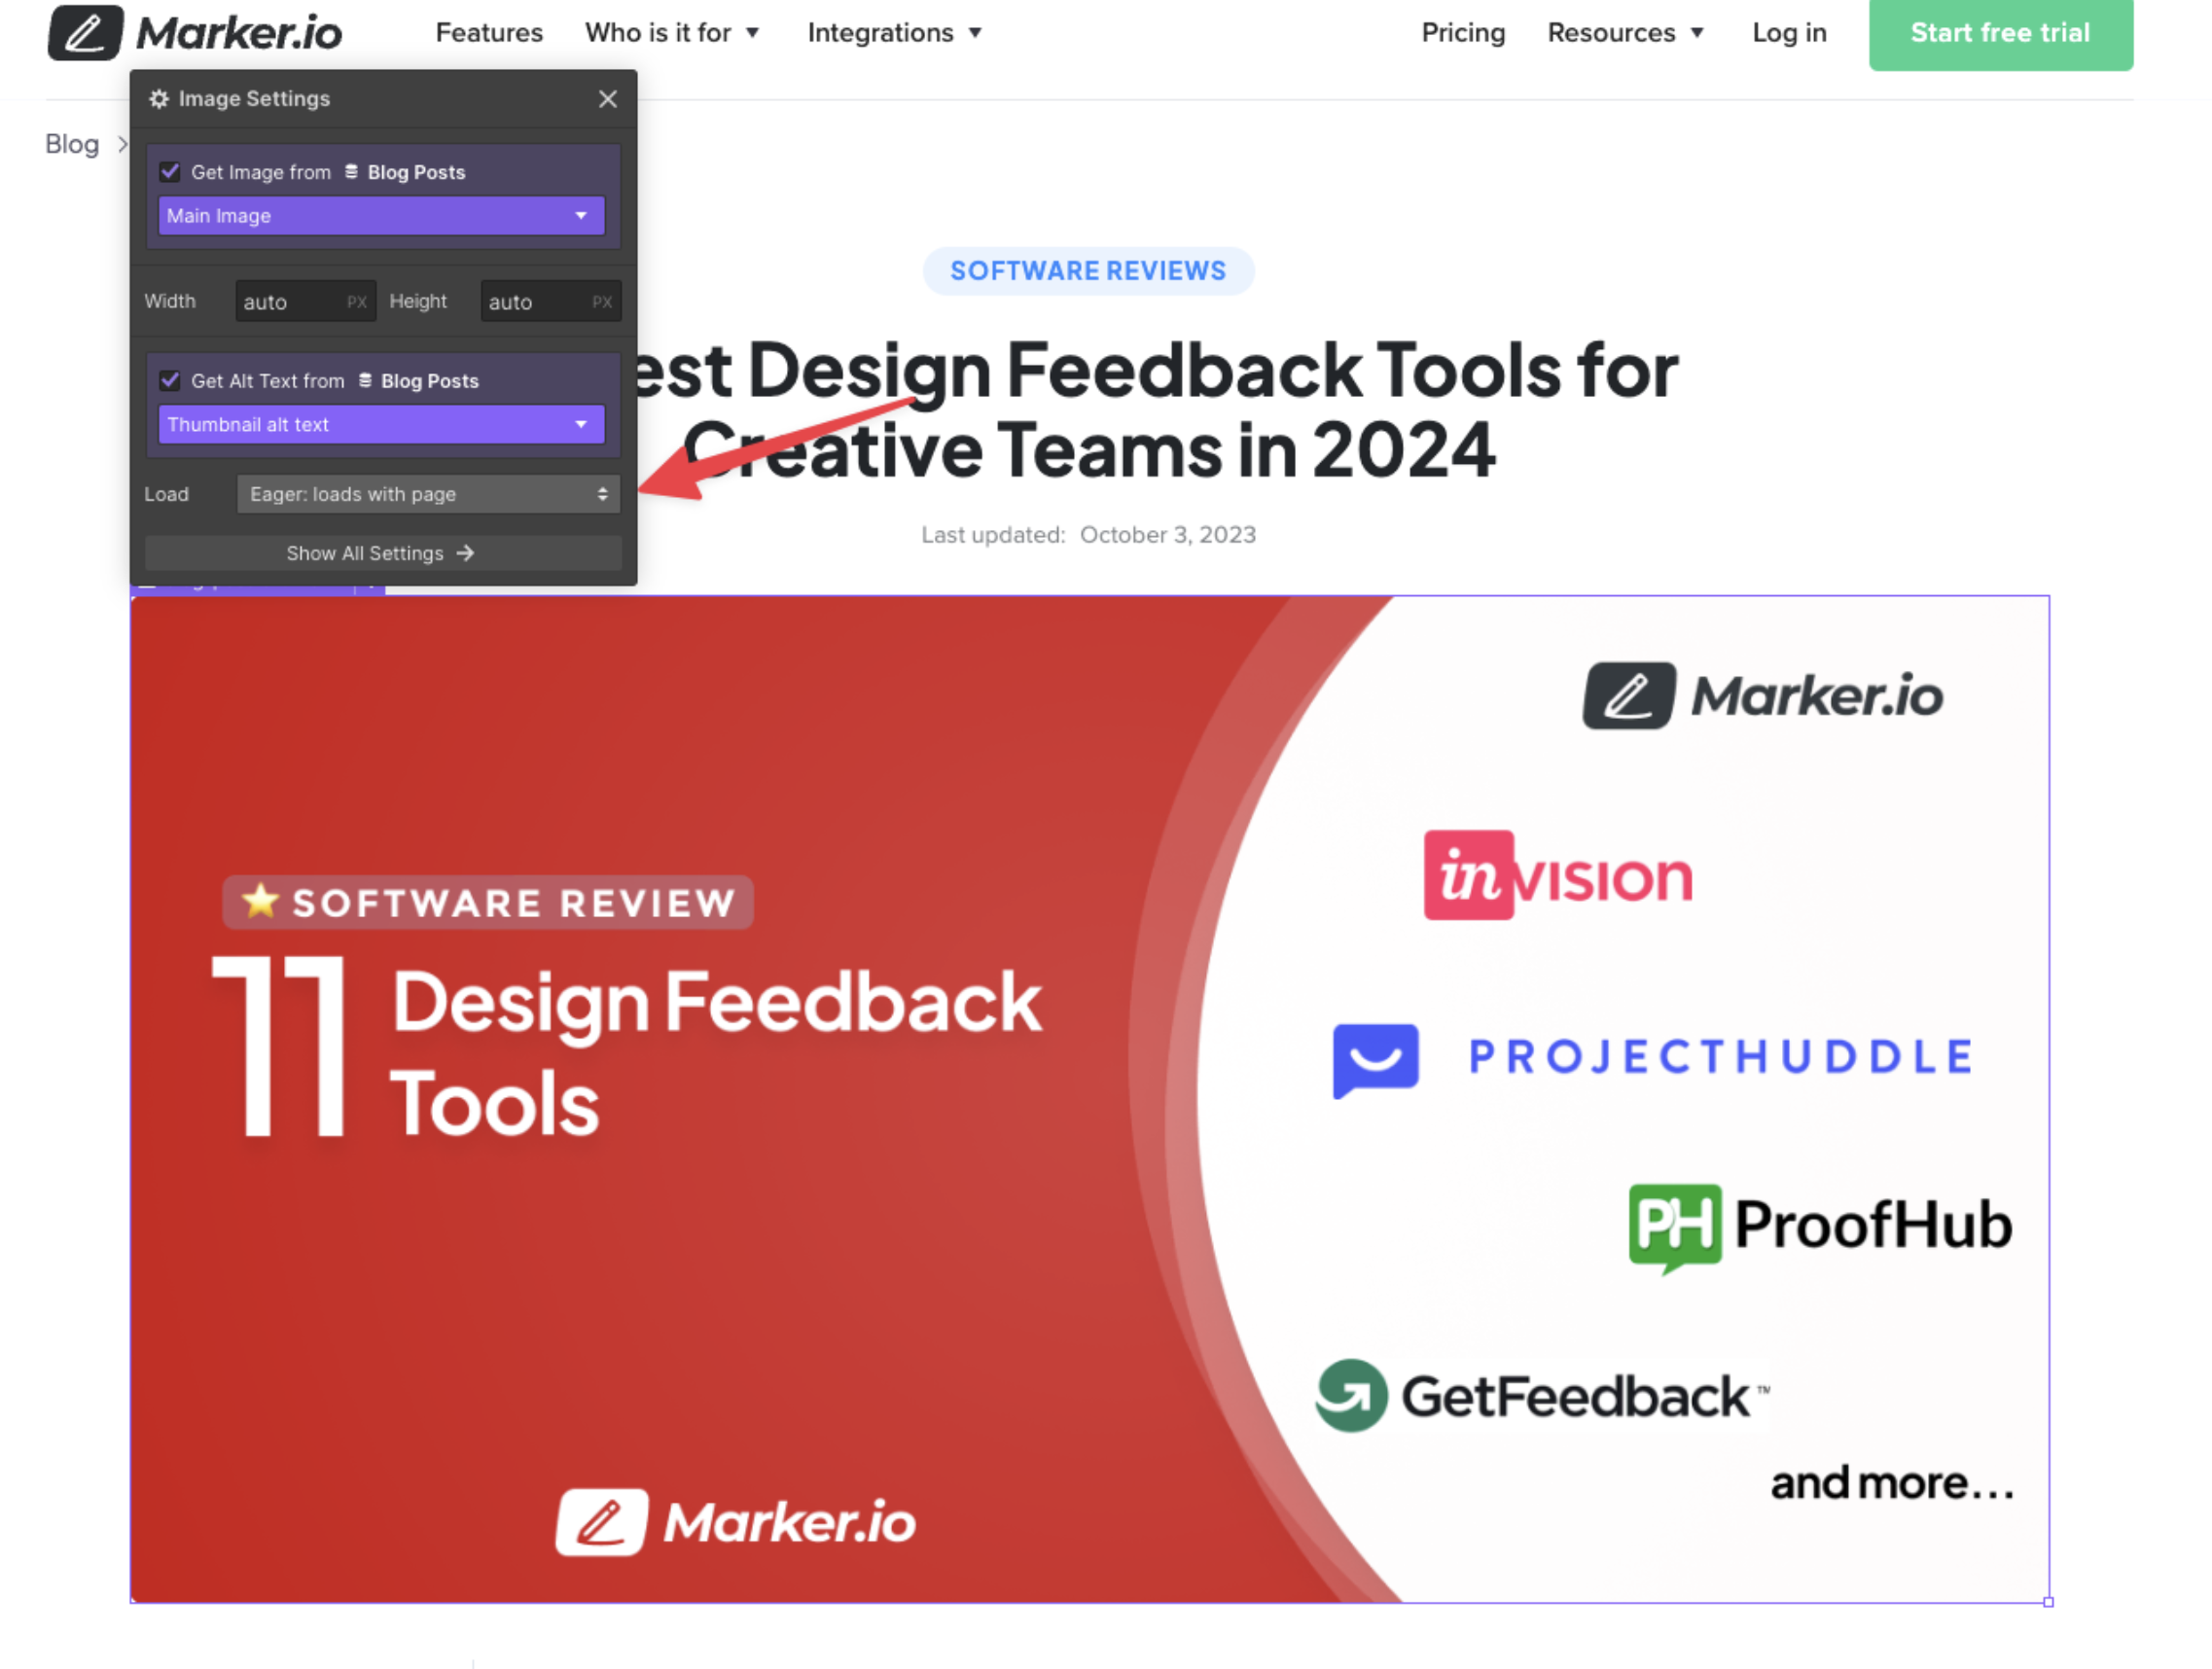
Ensure your LCP element is discoverable in your HTML document by the browser’s preload scanner.
This also means not lazy loading your LCP element, if it’s an image. For all pages with a large image above the fold, make sure the load setting is set to “eager” in Webflow:
3. Load Time
This is how long it takes to load the resource. If your LCP element is an image, load time is likely going to be the biggest offender here.
You have a few options:
After these optimizations, if you still have a very high LCP, you have another problem on your hands.
Your image is just taking up too much real estate on the page.
This is usually the case for background images, or very large images.
We took the decision to cut it, as our images didn’t add that much value to the content. They even forced our users to scroll to be able to read our posts.
4. Render Delay
Render delay on Webflow sites is caused by what Pagespeed Insights calls “unused” JavaScript. This code has to load before the LCP.
For us, it turns out to be business-critical scripts like the Google Tag Manager, Hotjar, or Clearbit.
If you spend some time researching this, you might find advice such as:
- Inline critical CSS—very inconvenient, and not relevant, as you tend to re-use the same components on multiple pages in Webflow
- Minify your stylesheets and JavaScript—also not relevant as Webflow handles this automatically
- Clean up your CSS—that would save only 30 to 50KiB and could break your site. Not recommended!
Don’t spend too much time trying to figure out how to optimize this for Webflow.
Optimizing LCP if your largest content element is an image
This was our biggest issue. If your LCP is still too high after optimizations:
- Remove it entirely, as we did
- Redesign your pages to use smaller images above the fold, and definitely no background images
Optimizing LCP if your largest content element is text
While custom fonts have a rather small file size, it can add up quickly:

Now, I understand you don't want the entire website to use Arial. Especially over the beautiful Google Fonts that exist out there.
But for the mobile version—or at the very least, non-critical marketing pages—it can make sense.
For example, we decided to use system fonts for the blog on mobile.
The reasoning is simple: if you’re accessing the blog from your phone, you want a quick answer to your query.
Sure, it may not look as good as another blog, but you make it up by offering a much better user experience.
5. Common problem #4: Reduce unused JavaScript / Reduce the impact of third-party code
With Webflow, the culprit for unused JavaScript is almost always third-party code.
That's why we're grouping those two warnings.
There aren’t many ways to fix this. You need to review the tools and scripts you need and don’t need, and simply remove or replace non-critical ones.
For us, it was just Intercom—we don’t need it on the blog.
6. Common problem #5: High Cumulative Layout Shift (CLS)

I don’t know about you, but I get viscerally annoyed whenever I have to browse a website on mobile.
Slow load times are OK: every site has different resources to download.
But once they’re loaded, I don’t expect my screen to jump around when I’ve already started reading the content.
Your CLS score should never be above 0.1.
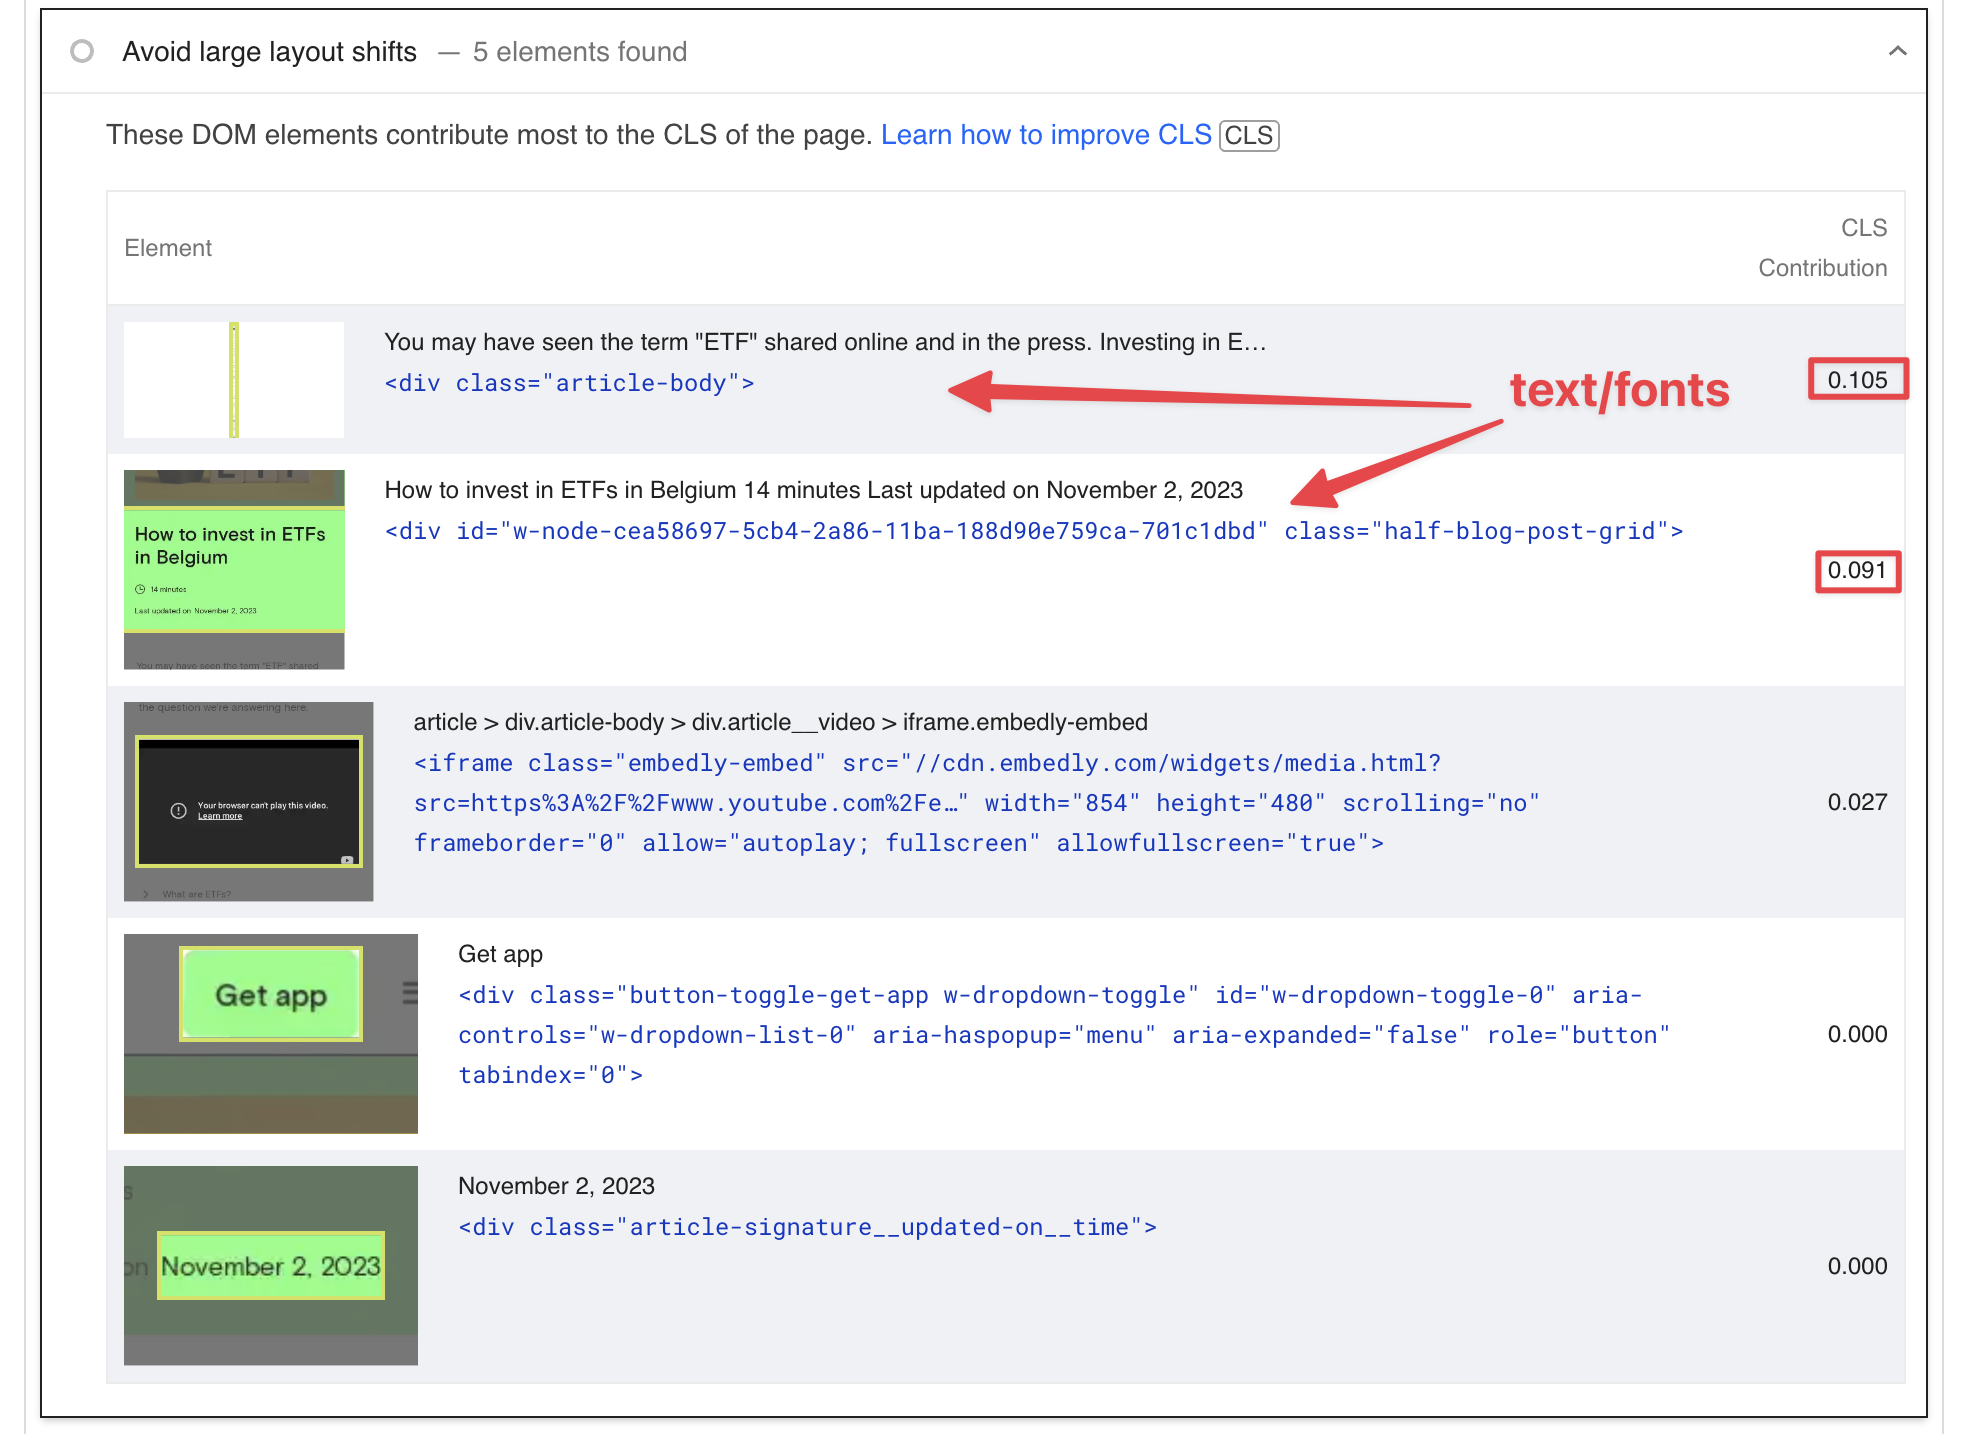
The Pagespeed Insights report will point out what elements cause a layout shift.
Often, custom fonts are at the root of the problem:
This improves perceived performance. The end-user will be able to read your content before they download your custom font.
But, when the font is downloaded, it will cause a significant layer shift during the swap. For us, this was yet another reason to use system fonts on mobile.
A second common cause I see on Webflow sites are late-loading elements near the top of the viewport.
For us, it was the table of contents on mobile.
The table of contents would load after the main body. This pushed the entire body down, and completely ruined the reading experience:
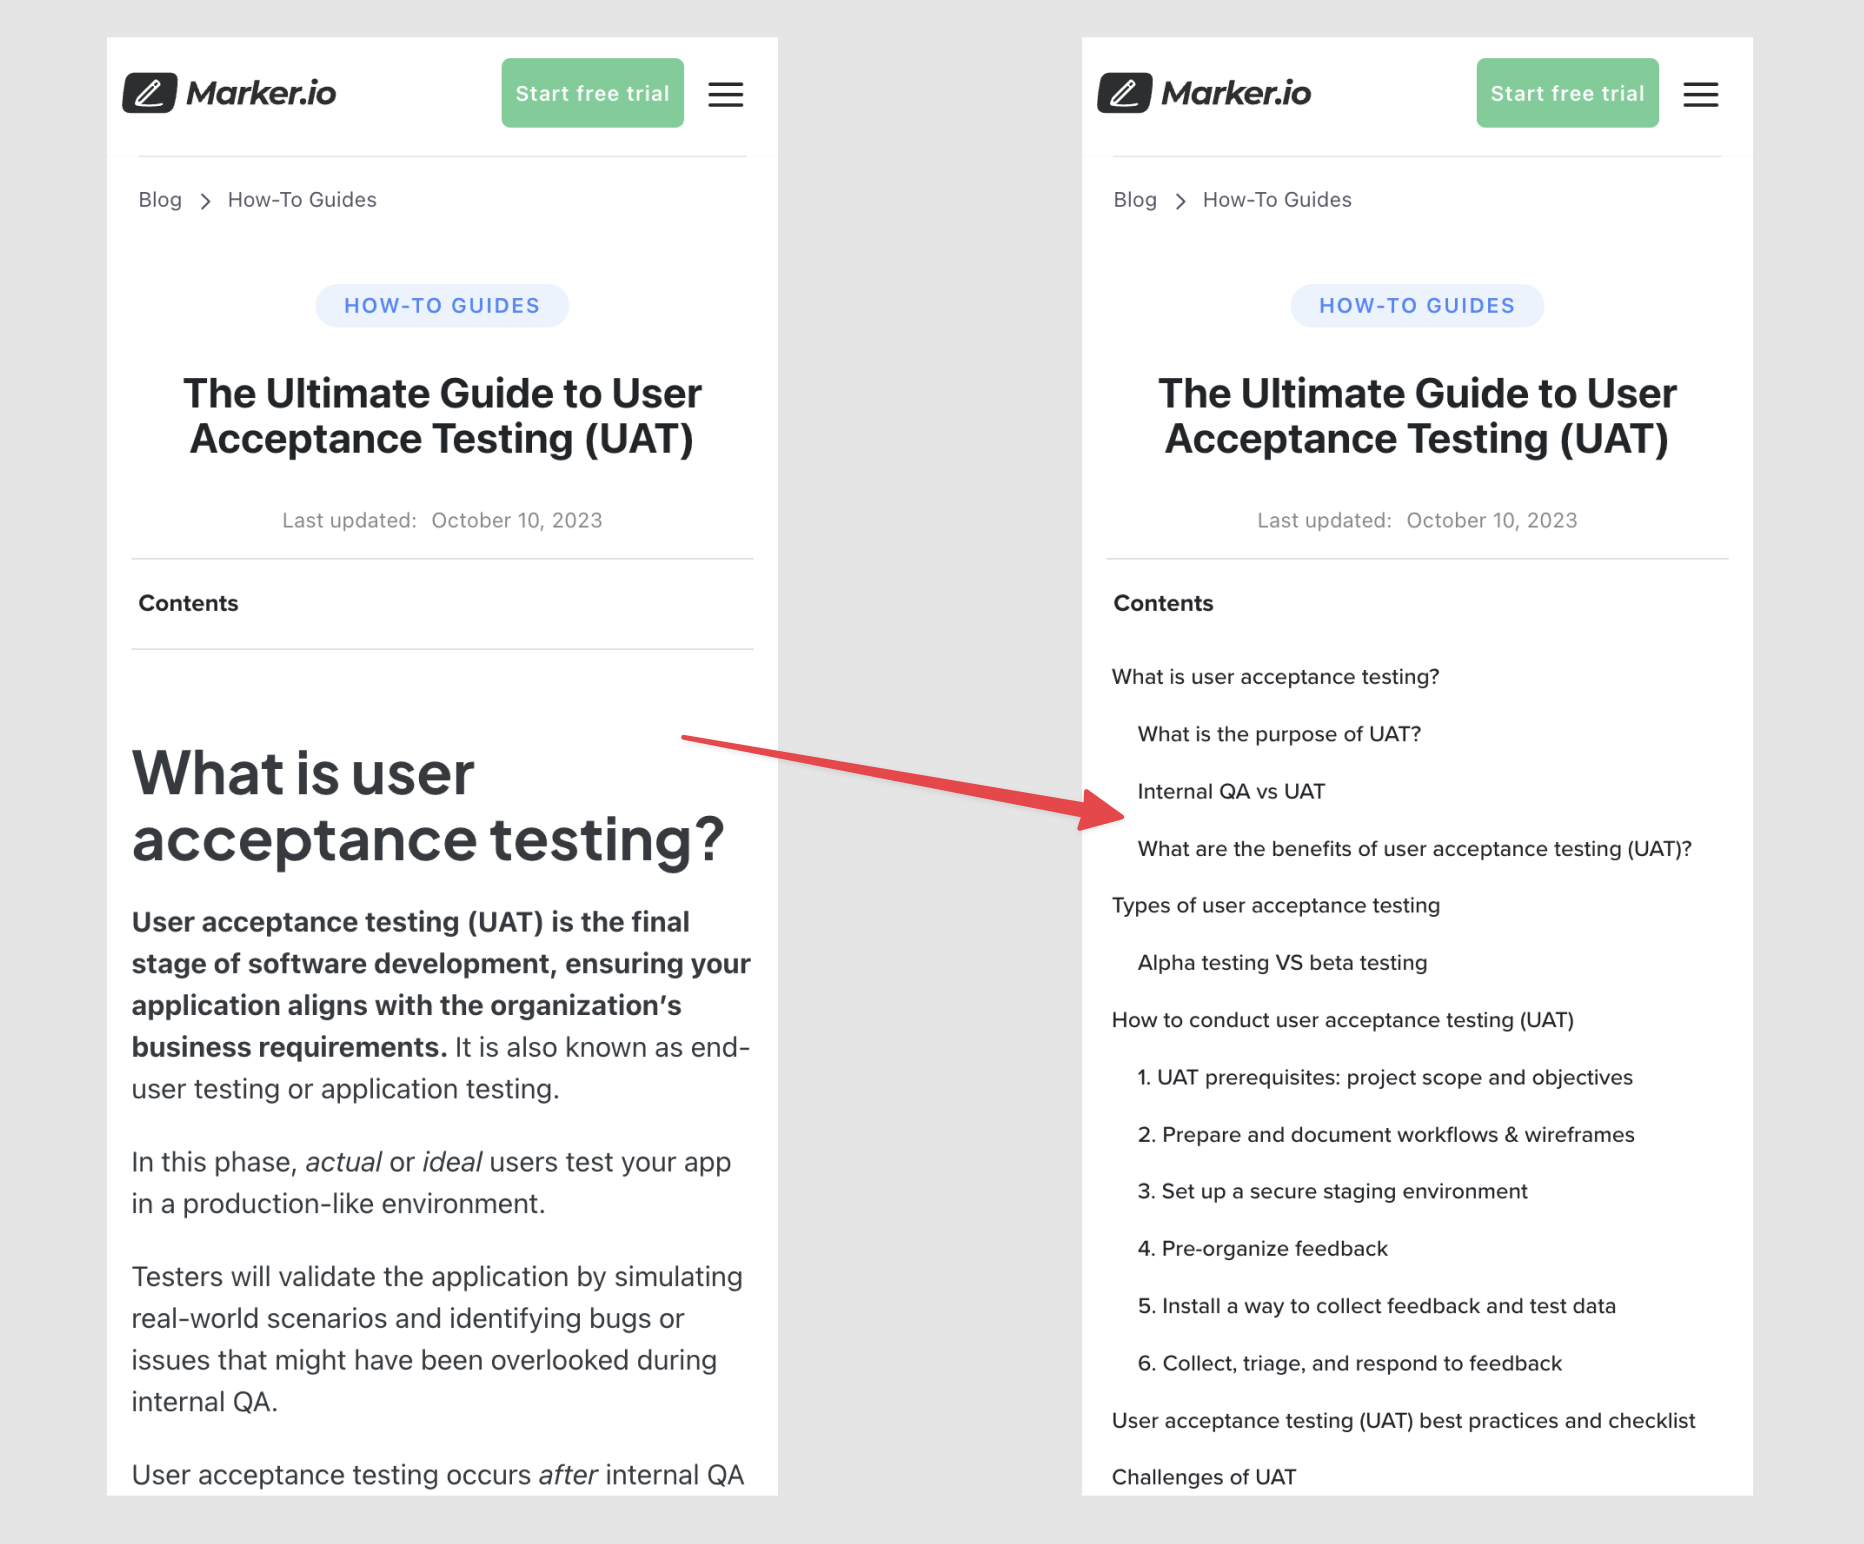
You can fix this in two ways:
- Reserve the appropriate space for the element that causes a layout shift;
- Change its functionality: we decided to keep the table of contents collapsed on mobile.
Webflow site performance: closing advice
And that about wraps up our advice to improve your Webflow website speed.
One final recommendation is to take the Pagespeed Insights report with a pinch of salt. At times, it feels like the tool will only be satisfied if you serve a completely blank page.
It’s too easy to go down the rabbit hole of speed optimization and end up spending hours on something that will save 20ms at best.
In my opinion, as long as you pass the Core Web Vitals Assessment, your site is good to go.
Extra resources
If you end up using Cloudinary, we have three resources for you:
- A Codepen to implement Cloudinary with Webflow: Codepen Link
If you’re like me, working on a site with a ton of content and dread the idea of manually replacing thousands of images with their respective code blocks, you can use the following two Python scripts:
- Downloading all images and alt text on a page: Pastebin Link
- Upload to Cloudinary and print a code block with alt text to easily copy-paste in Webflow: Pastebin Link
And that's it. Good luck with your speed optimizations!
What should I do now?
Here are three ways you can continue your journey towards delivering bug-free websites:
Check out Marker.io and its features in action.
Read Next-Gen QA: How Companies Can Save Up To $125,000 A Year by adopting better bug reporting and resolution practices (no e-mail required).
Follow us on LinkedIn, YouTube, and X (Twitter) for bite-sized insights on all things QA testing, software development, bug resolution, and more.
Nathan Vander Heyden
Nathan is Head of Marketing at Marker.io. He used to work as a SEO consultant for various SaaS companies—today, he's all about helping Web Ops teams find more efficient ways to deliver bug-free websites.
Related blog posts


Get started now
Free 15-day trial • No credit card required • Cancel anytime