Reproduce Bugs Faster with Console Logs Recording
Let the Marker.io widget record client-side Javascript errors automatically. Your developers will love you for it!


Let the Marker.io widget record client-side Javascript errors automatically. Your developers will love you for it!
The missing piece in bug reports
When a bug appears, there is a very good chance there is an error in the JavaScript. You can always see these errors when you open the script of that website, but it is not an obvious thing to do. Especially for less-technical team members of clients.
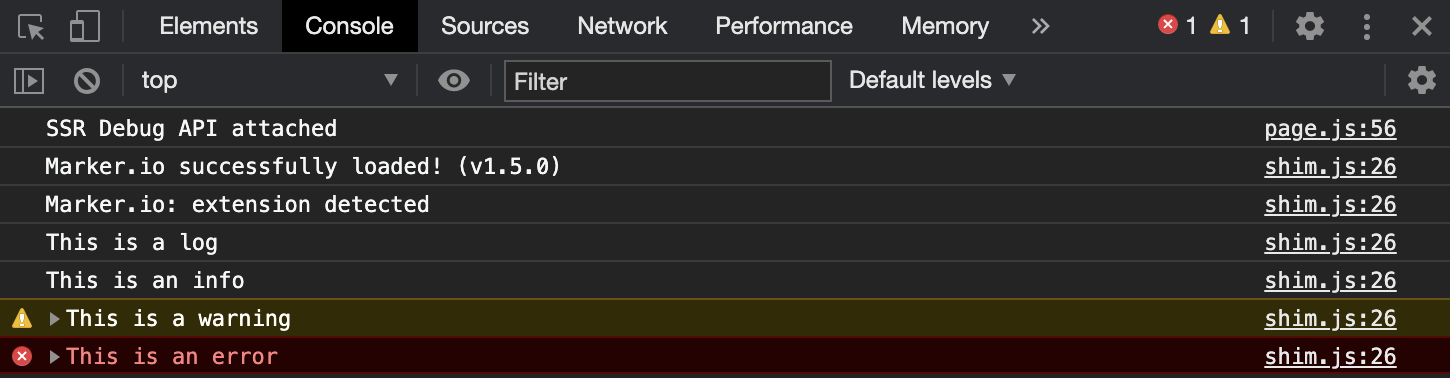
Did you know that most bugs could be reproduced a lot faster if developers could see errors in your console? For a developer, console logs are the closest thing to "looking at your screen over your shoulder". But developers almost never get this info for 2 reasons:
- Unaware: Most people don't even know what console logs are, let alone how to see and report them.
- Forgetfulness: For those who know what console logs are, they still have to remember to open their console, capture a screenshot of the logs, and send it along the bug reports.
No wonder developers rarely get this info!
Introducing automatic console log recording in Marker.io!
Automatic recording of console logs has been one of our most requested feature!

Every time someone reports a bug, your Marker.io widget can now automatically record the Client-side JavaScript errors and logs of that exact moment and that exact issue.
These console logs get attached to any issue submitted and get delivered straight into your issue tracking or project management tool.
Exploring console logs
When a dev opens an issue in Jira, Trello or whatever tool your team uses, there will now be a new mention. This link shows you if there are any relevant console logs for a developer to see. Any errors, warnings and other info will be mentioned in this link.
For developers, this is a great time and energy saver! No more unnecessary back and forth, no more asking for the same things time and time again, and a more efficient workflow.
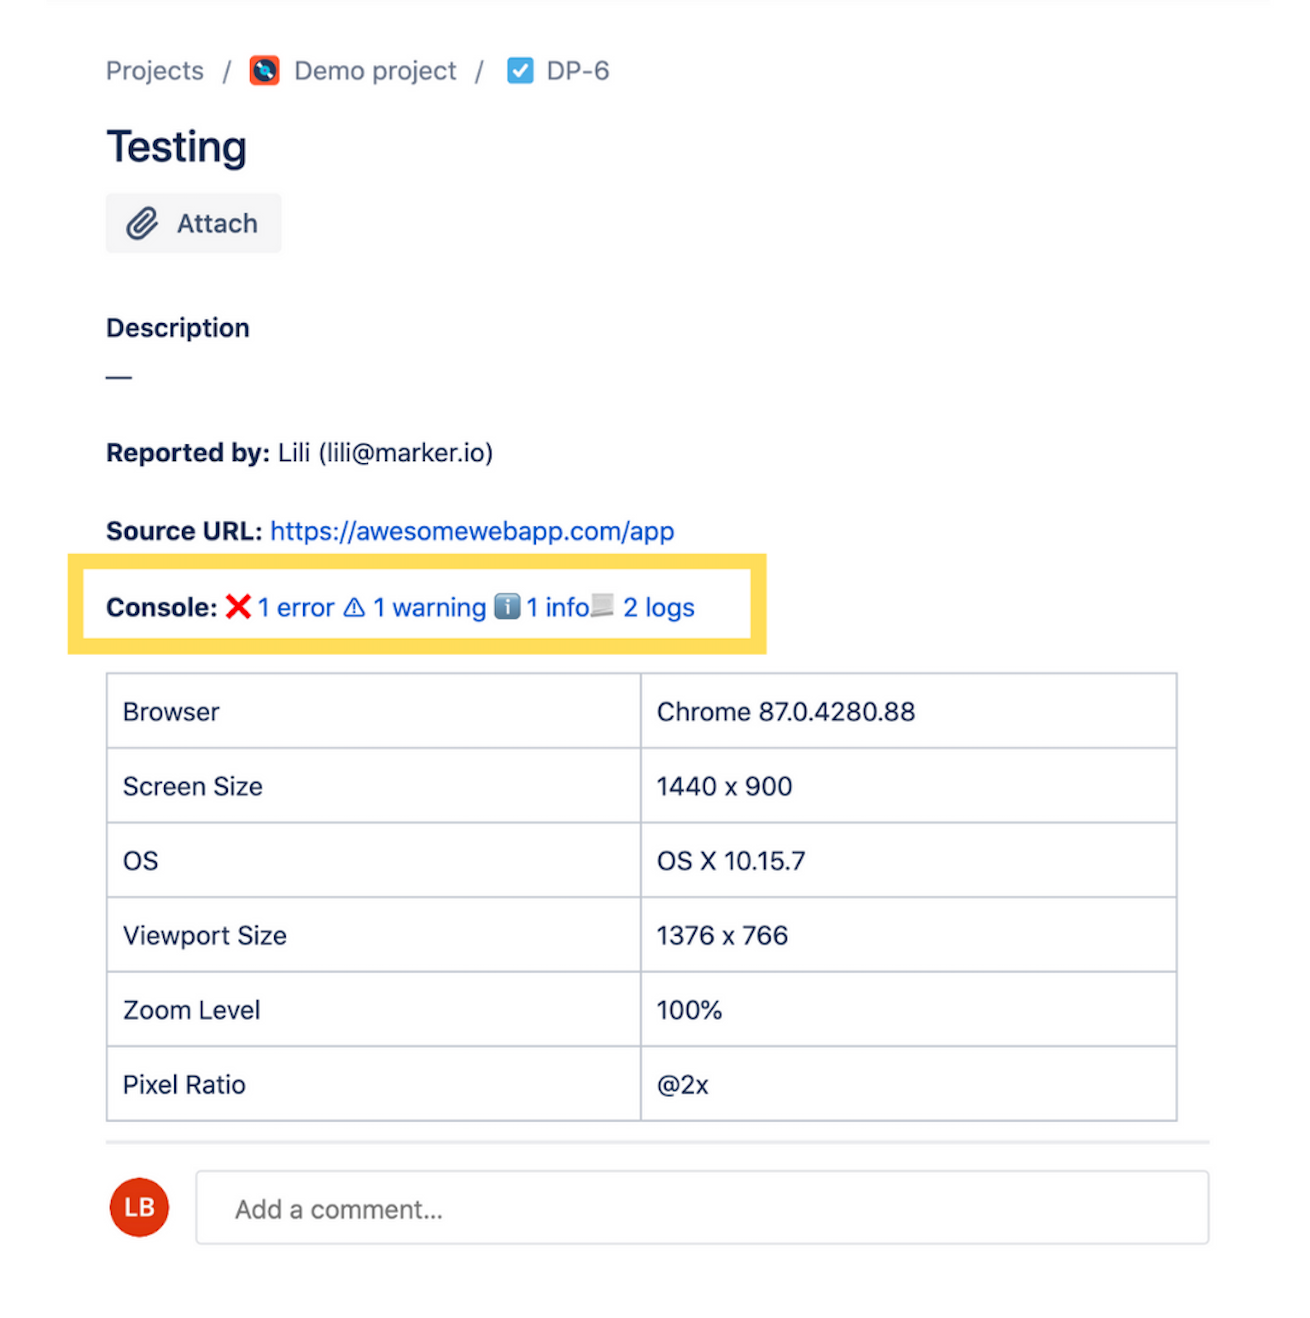
You can now click this link to see the full console logs as they were on the moment of the capture. It is like freezing the bug in time.

How to get started?
To enable the console logs recording, go to one of your Destination, then go to Widget > Automatic data capture > Console logs.
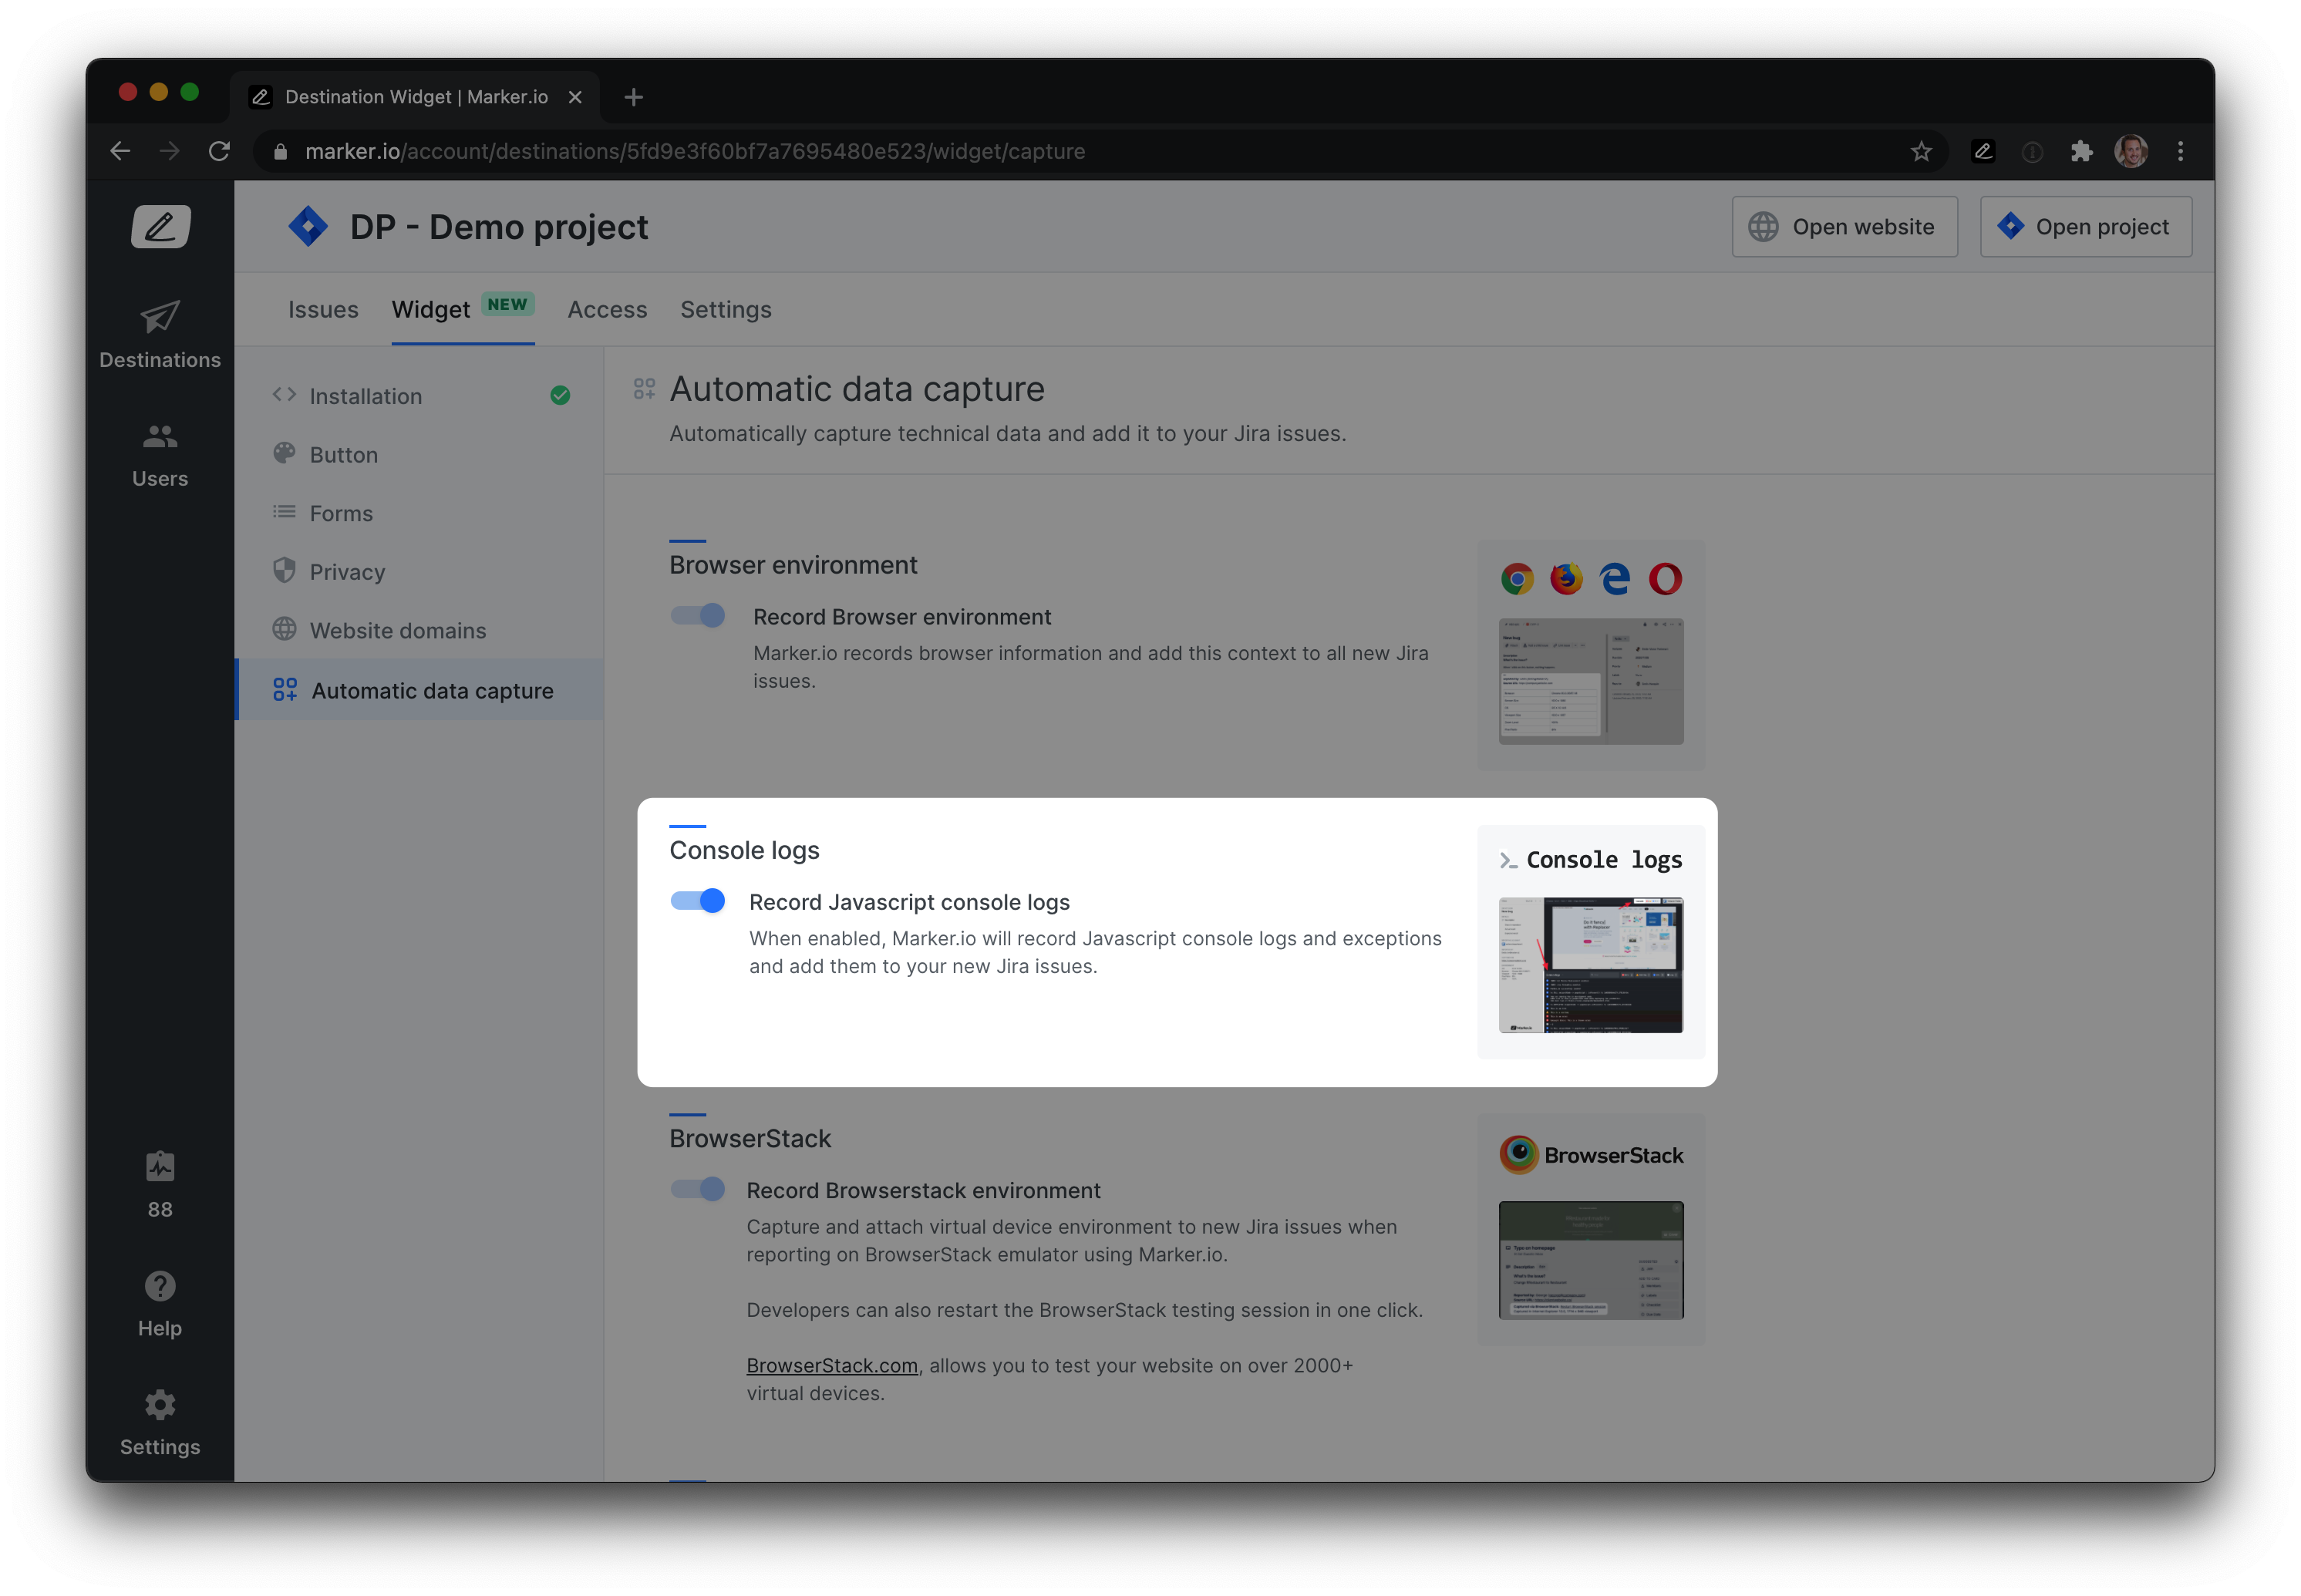
For optimal result, we recommend that you install your widget via snippet code.
This feature is available on the Team and Company plans. Check here to check if you have access.
What should I do now?
Here are three ways you can continue your journey towards delivering bug-free websites:
Check out Marker.io and its features in action.
Read Next-Gen QA: How Companies Can Save Up To $125,000 A Year by adopting better bug reporting and resolution practices (no e-mail required).
Follow us on LinkedIn, YouTube, and X (Twitter) for bite-sized insights on all things QA testing, software development, bug resolution, and more.
Gary Gaspar
Gary is Marker.io's CEO. He's passionate about startups, growth and business. Before Marker.io, he ran a web design agency. Outside of work, he's the biggest basketball fan!
Related blog posts

Get started now
Free 15-day trial • No credit card required • Cancel anytime